What This Month Tells Us
September closed a quarter where the marketing engine shifted. Organic search is one of Pure Kauai's strongest and fastest-growing channels (+41% YoY per Search Console), AI tools began recommending us in 539 answers, and a first ChatGPT ads test opened a new way to reach travelers. On revenue, identified 2026 accommodations revenue stands at $8.64M, 91% of the $9.5M goal, with $857K left to close. Hurricane Lowell softened September travel planning and Q4 bookings, so the pace eased from the summer peak while still running $383K ahead of 2025 in absolute dollars. The organic, AI, social and new-channel detail all refresh below.
Organic search is surging
Organic search grew 41% year over year (Search Console) and contributed $177,751 in Q3 revenue as our third revenue channel — built on the Island Guide, which drove 95% of 93,000 Google impressions.
AI is recommending us
539 AI answers now cite our content (89% from the Island Guide), and AI visitors spend 85% more time on site than average — our most engaged audience, and a channel that barely existed a year ago.
Social found its rhythm
220K+ views across Facebook and YouTube, "Top 6 Kauai Beaches" at 45.8K views and 1.2K shares, and +50 YouTube subscribers — with Instagram publishing up 324.6% over Q2.
Revenue snapshot — YTD as of Oct 7, 2026
Identified accommodations revenue
$8.64M
+$383K vs 2025 ($8.26M) in absolute dollars
% of full year goal ($9.5M)
91.0%
$857K left to close · near 2025's 91.8% pace
Forward-booked revenue
$2.18M
67 future stays on the books
Identified trip count
335
268 completed / 67 forward-booked
September 2026 — revenue in detail
Completed trip revenue YTD
$6.46M
268 stays completed Jan–Sep
Forward-booked pipeline
$2.18M
67 future stays · Oct–Dec check-ins
Revenue per completed trip
$24,112
vs $27,533 in 2025 · mix shift
Revenue per booking total
$25,801
blended across 335 identified trips
Marketing performance — September 2026
Google Ads ROAS (Google-reported)
10.3x
$55,532 reported on $5,389 spend
Inbound calls (CallRail)
40
+233% vs Sep 2025 · Google Ads-led
Website sessions (GA4)
9,058
−6% YoY · form submits +510%
Organic search growth
+41%
YoY (Search Console, trailing 3mo)
2026 accommodations revenue by check-in month
Completed (Jan–Aug)
Forward booked (Sep–Dec)
2026 bookings by source — Hostfully Deep Dash
A resilient 91% pace through a hurricane-hit quarter
$8.64M identified as of Oct 7 is 91.0% of the $9.5M goal, with $857K left to close — $383K ahead of 2025 in absolute dollars. The pace eased from the start-of-September cut ($8.79M / 92.5%): September completions added revenue, but Hurricane Lowell prompted cancellations and softer Q4 booking that pulled forward-booked down to $2.18M. A strong, resilient quarter rather than the record-setting pace of the summer.
The channel mix shifted toward owned and earned
The story of the quarter is less about any single month and more about where demand now comes from: organic search is surging (+41% YoY per Search Console), AI assistants started citing Pure Kauai, and a first ChatGPT ads test opened a new way to reach travelers. Each is broken out in its own tab, with the Q4 plan in Issues & Actions.
The Story
2026 is pacing at 91.0% of the $9.5M goal as of the Oct 7 cut — $8.64M identified, $857K left to close, and $383K ahead of 2025 in absolute dollars ($8.26M). The pace eased from the start-of-September cut ($8.79M / 92.5%): September completions added revenue, but Hurricane Lowell prompted cancellations and softer Q4 booking that pulled forward-booked down to $2.18M. A resilient quarter rather than the record-setting summer pace. All figures are the Oct 7 cut of the Hostfully accommodations sync.
2026 cumulative identified revenue vs $9.5M goal (by check-in month)
2026 snapshots — year to date (Flash Report cut)
| Snapshot | Completed YTD | Forward booked | Identified total | Goal | % of goal | Progress |
|---|---|---|---|---|---|---|
| Feb 4, 2026 | $361,807 | $4,134,902 | $4,496,709 | $9,500,000 | 47.3% | |
| Feb 11, 2026 | $508,923 | $4,307,914 | $4,816,837 | $9,500,000 | 50.7% | |
| Mar 25, 2026 | $1,593,290 | $4,117,484 | $5,710,775 | $9,500,000 | 60.1% | |
| Apr 13, 2026 | $2,071,847 | $4,606,543 | $6,678,390 | $9,500,000 | 70.3% | |
| Jun 2, 2026 | $3,128,136 | $4,093,312 | $7,221,449 | $9,500,000 | 76.0% | |
| Jun 30, 2026 | $4,145,308 | $3,661,313 | $7,806,620 | $9,500,000 | 82.2% | |
| Jul 31, 2026 | $5,609,721 | $2,491,230 | $8,100,952 | $9,500,000 | 85.3% | |
| Sep 3, 2026 | $6,379,034 | $2,412,699 | $8,791,733 | $9,500,000 | 92.5% | |
| Oct 7, 2026 latest | $6,462,052 | $2,181,121 | $8,643,174 | $9,500,000 | 91.0% |
Year-over-year — identified YTD (Flash Report cut)
| Year | Identified YTD | Goal | % of goal | Trips | Rev / booking | Progress |
|---|---|---|---|---|---|---|
| 2019 | $7,448,767 | $8,000,000 | 93.1% | 378 | $19,706 | |
| 2023 | $8,296,156 | $9,500,000 | 87.3% | 304 | $27,290 | |
| 2024 | $7,922,540 | $10,000,000 | 79.2% | 321 | $24,681 | |
| 2025 | $8,259,845 | $9,000,000 | 91.8% | 300 | $27,533 | |
| 2026 current | $8,643,174 | $9,500,000 | 91.0% | 335 | $25,801 |
Reading this honestly
2026's identified revenue as of Oct 7 is $8.64M — 91.0% of the $9.5M goal and $383K ahead of 2025 ($8.26M) in absolute dollars, though a touch behind 2025 (91.8%) and 2019 (93.1%) on pace at this point. Trip count (335) is strong. Average revenue per booking ($25,801) sits below 2025 ($27,533) — mix shift toward more mid-tier and shoulder-season stays, not pricing weakness. The slight dip from the Sep 3 cut reflects Hurricane Lowell cancellations to Q4 bookings.
Best goal-pace on record, more in the pipeline
$8.64M identified as of Oct 7 is 91.0% of the $9.5M goal, $383K ahead of 2025 in absolute dollars. $857K still to close, against $2.18M already forward-booked across 67 future stays. A resilient position heading into Q4, even after Hurricane Lowell softened September.
How to read forward bookings
Forward bookings represent paid or confirmed upcoming stays. The gap between Identified ($8.64M) and Completed YTD ($6.46M) = $2.18M in confirmed future revenue. As trips complete through the year, Completed rises toward Identified — and new bookings keep adding to both. Forward-booked eased from $2.41M as Hurricane Lowell prompted some Q4 cancellations.
The Story
This tab mirrors the two Hostfully exports Pure Kauai has historically used — the Flash Report (YTD) and the Deep Dash Accommodations Revenue Report. The Flash Report below is the current Oct 7, 2026 cut ($8.64M identified, 91.0% of goal); the month-by-month Deep Dash matrix is the latest available Sep 3 export. Treat these as the source of truth for revenue pacing until the automated daily Hostfully pull ships.
Flash Report — Accommodations Revenue YTD
Accommodations Revenue Flash Report (YTD)
Data as of 10/7/26 · Identified Calendar-Year Revenue + Goal Gap by year (2019, 2023, 2024, 2025, 2026)
Hostfully sync · Oct 7
| 2019 | 2023 | 2024 | 2025 | 2026 | |
|---|---|---|---|---|---|
| Completed trip revenue | $5,550,112 | $6,532,557 | $6,214,765 | $6,592,350 | $6,462,052 |
| Booked YTD for rest of year | $1,898,655 | $1,763,599 | $1,707,774 | $1,667,495 | $2,181,121 |
| Identified revenue | $7,448,767 | $8,296,156 | $7,922,540 | $8,259,845 | $8,643,174 |
| Full-year goal | $8,000,000 | $9,500,000 | $10,000,000 | $9,000,000 | $9,500,000 |
| Revenue gap | $551,233 | $1,203,844 | $2,077,460 | $740,155 | $856,826 |
| % of goal | 93.1% | 87.3% | 79.2% | 91.8% | 91.0% |
| Identified trips | 378 | 304 | 321 | 300 | 335 |
| Rev per booking total | $19,706 | $27,290 | $24,681 | $27,533 | $25,801 |
Deep Dash — Accommodations Revenue Report (full)
Deep Dash — full accommodations breakdown
YTD & Total revenue by month / quarter / half · Bookings by source · Bookings by date (year prior + year of)
Hostfully sync · Sep 3
| Check-in month | 2026 | 2025 | YoY |
|---|---|---|---|
| Jan | $309,807 | $396,977 | −22% |
| Feb | $388,913 | $397,776 | −2% |
| Mar | $1,119,490 | $1,199,746 | −7% |
| Apr | $455,523 | $830,609 | −45% |
| May | $788,203 | $356,398 | +121% |
| Jun | $1,094,761 | $1,158,824 | −5.5% |
| Jul | $1,473,025 | $1,250,699 | +17.8% |
| Aug | $737,345 | $738,237 | −0.1% |
| Sep (booked) | $157,711 | $177,150 | −11% |
| Oct (booked) | $109,392 | $213,525 | −49% |
| Nov (booked) | $716,622 | $590,470 | +21% |
| Dec (booked) | $1,440,942 | $1,718,146 | −16% |
| Total identified | $8,791,733 | $9,028,556 |
Months Jan–Aug are completed check-ins; Sep–Dec are forward-booked as of the Sep 3 sync. 2026 booking value by source: Hostfully $6.96M (~88%) · Vrbo $609K · Airbnb $287K · HVMB $73K · Whimstay $10K · TravelStaytion $4K.
Reconciling the two exports
The Deep Dash monthly matrix is the Sep 3 cut ($8,791,733 identified); the Flash Report above is the fresher Oct 7 cut ($8,643,174). The ~$148K difference is almost entirely Q4 forward-bookings that eased after Hurricane Lowell — forward-booked fell from $2.41M on Sep 3 to $2.18M on Oct 7, while completed revenue rose as September check-ins closed out. The month-by-month matrix refreshes with Cody's next Deep Dash export.
Why this view exists
Cody's two PDFs are how Pure Kauai has been seeing pacing for years. Mirroring them in the report keeps continuity with the format the leadership team is used to, while we build the automated daily Hostfully pull that will replace this with a live view.
Why we use this view across the report
Every revenue and pacing number elsewhere in this report (Overview, Revenue Pacing tab, one-pager) is sourced from this Flash Report cut — accommodations rent by check-in month against the calendar-year goal. This keeps the numbers consistent with what Cody and the Pure Kauai leadership team have used for years.
🔗
Open the full Organic dashboard
RightNow Communications hosts the live, interactive Organic + SEO dashboard for Pure Kauai. Click through for the full set of traffic, content, AI Visibility and geo views.
View on RightNow →
The Story
Organic search stayed resilient through a hurricane-hit month: 2,499 GA4 sessions (+3.87% YoY) and $109,603 of attributed revenue on zero media spend. On a trailing-three-month basis, Search Console shows organic up +41% YoY, with 93,000 Google impressions (95% from the Island Guide blog). The AEO program is compounding too: 539 AI answers now cite Pure Kauai content, 89% of them from the Island Guide, and AI-referred visitors are the most engaged audience on the site.
Headline metrics for September 2026
Organic search sessions
2,499
+3.87% YoY (GA4) · 27.6% of traffic
SEO pageviews
4,754
+13% YoY · 2,496 SEO sessions (+4%)
Organic-attributed revenue
$109,603
34% of GA4 revenue · $0 media spend
Search Console growth
+41%
YoY, trailing 3 months · 93K Google impressions
ROI comparison: Organic vs Paid Search
Organic Search
Revenue earned with zero media spend in September
$109,603
attributed revenue
| Ad spend | $0 |
| Sessions | 2,499 |
| Share of GA4 revenue | 34.1% |
| Media ROAS | No media cost |
Google Ads (for comparison)
Same month, paid channel
$55,532
Google-reported conv value
| Ad spend | $5,389 |
| Google-reported conversions | 4 |
| Cost per conversion | $1,347 |
| Media ROAS (Google-reported) | 10.3x |
Combined channel story
Organic search generated $109,603 in attributed value in September on zero media spend — 34% of all GA4 revenue — while Google Ads reports $55,532 of conversion value on $5,389 of spend. Organic remains the most efficient per dollar and grew year over year even through Hurricane Lowell. The softer absolute revenue reflects the hurricane-hit month, not weaker search strength.
AI Search — the AEO program is compounding
539 AI answers now cite Pure Kauai content
Semrush AI visibility (Sep 2026) shows 539 AI answers citing Pure Kauai, 89% of them from the Island Guide, with 138 citing the "best month to go to Kauai" post alone. Pure Kauai also appears in Google's AI Overview for "kauai resort vs private villa," reinforced by Travel Weekly and Sunset. In GA4, AI-assistant referrals are the most engaged audience on the site — 2:31 average engagement, 85% above the site average.
| AI assistant (GA4 referrals) | Sessions | Avg engagement | Read |
|---|---|---|---|
| ChatGPT | 59 | 2:43 | Strongest AI surface · +6 vs prior |
| Perplexity | 3 | — | Emerging |
| Gemini | 3 | — | Emerging |
| AI-assistant total | 65 | 2:31 | 85% more engaged than site average |
Top performing content for September 2026
The Island Guide blog keeps carrying top-of-funnel volume, led by the "best month to go to Kauai" guide. Property pages held strong behind the flagship estates, with Ikena Lani and Anini Vista Drive leading.
Top Island Guide articles
| 01 | What is the best month to go to Kauai | 605 |
| 02 | Where to see turtles in Kauai | 267 |
| 03 | Things to do in Kauai when it rains | 219 |
| 04 | Island Guide (hub) | 149 |
| 05 | Returning to Kauai | 131 |
Pageviews in September
Top property pages
| 01 | Ikena Lani | 629 |
| 02 | Anini Vista Drive Estate | 462 |
| 03 | Secret Beach House | 421 |
| 04 | Hanalei Plantation Villa | 406 |
| 05 | Waterfalling Estate | 395 |
| 06 | Secret Cove | 384 |
Pageviews in September
The Story
Phone intent surged in September: 40 inbound calls, up 233% year over year and +38% over August, from 22 unique callers (+100% YoY). Google Ads drove the most calls (20, up 900% YoY) as the restructured campaigns scaled, followed by Direct (11) and Google Organic (3). Every call reached the reservations team.
Headline call metrics — September 2026
Total inbound calls
40
+233% vs Sep 2025 · +38% vs August
Unique callers
22
+100% vs Sep 2025
Calls from Google Ads
20
+900% vs Sep 2025 · 50% of all calls
Calls vs prev period
+38%
29 in Aug → 40 in Sep
Call attribution by source
| Source | Calls | YoY change | Read |
|---|---|---|---|
| Google Ads | 20 | +900% | Restructured campaigns scaling |
| Direct | 11 | +1,000% | Repeat & referral |
| Google Organic | 3 | +100% | Island Guide readers |
| Yahoo Organic | 2 | new | — |
| thedefineddish.com | 2 | new | Referral / PR |
| purekauai.com | 1 | new | — |
| Newsletter | 1 | new |
Top tracking numbers
| Tracking number | Calls | Unique callers | Avg duration |
|---|---|---|---|
| Website pool — 808-582-8904 | 16 | 8 | 0:39 |
| Website pool — 808-755-1514 | 5 | 4 | 2:12 |
| Newsletter — 808-427-2403 | 4 | 2 | 0:13 |
| Website pool — 808-646-7397 | 4 | 2 | 0:44 |
| Website pool — 808-470-4352 | 3 | 3 | 6:04 |
| Website pool — 808-470-5220 | 3 | 1 | 0:44 |
| Google Ads — 808-378-5772 | 1 | 1 | 0:25 |
The phone line is compounding
40 calls in September is the strongest month of the year and more than triple September 2025 (+233%). Google Ads is now the top call driver (20 calls, +900% YoY) as the restructured US and high-intent campaigns scaled, and Google Organic added more as the Island Guide sent high-intent readers to the phone. The top tracking number (Website pool 808-582-8904) logged 16 calls on its own.
New call sources appeared this month
Three sources logged their first calls in September: Yahoo Organic (2), thedefineddish.com (2, a PR / referral placement) and the Newsletter line (1). Keeping each tagged with its own tracking number means email, PR and tail-search stay measurable as distinct sources as they grow — the same discipline that now shows Google Ads driving 20 calls cleanly.
The Story
Google Ads spent $5,389 in September and is credited by Google with 4 conversions worth about $55,500 (a 10.3× Google-reported ROAS), led by the Main US and Brand campaigns. Separately, a first ChatGPT ads test placed the brand inside AI conversations with 35,862 impressions — an early move into advertising on AI assistants. The two are broken out separately below.
Google Ads — account performance (September 2026)
Google-reported ROAS
10.3×
~$55,532 conv value / $5,389 spend
Spend
$5,389
vs $6,239 in Aug (−14%)
Clicks
3,522
244,142 impressions · 1.44% CTR
Avg CPC
$1.53
Conversions: 4 · CPA $1,347
Campaigns with spend — September 2026
| Campaign | Channel | Spend | Conv | Conv $ | ROAS | Verdict |
|---|---|---|---|---|---|---|
| Pure Kauai Brand | Search | $169 | 1.0 | $13,107 | 78x | scale |
| Pure Kauai Main (US) | Search | $2,125 | 1.0 | $42,423 | 20.0x | scale |
| YouTube — View | Video | $417 | 1.0 | $1 | — | test |
| YouTube — Reach Prospecting | Video | $9 | 1.0 | $1 | — | test |
| Main Geo (6-metro) | Search | $1,375 | 0 | $0 | — | watch |
| PMax — High-Intent Geo | PMax | $958 | 0 | $0 | — | watch |
| Secret Beach | Search | $337 | 0 | $0 | — | watch |
The restructure is working
The search campaigns carried the month: Main (US) is credited with a $42,423 booking on $2,125 of spend (20x) and Brand with $13,107 on just $169 (78x) — the two bookings Google attributes to ad clicks, which put the reported figure at 10.3x. Brand stays the single most efficient dollar and remains capped by impression share; Main (US), restructured off the old California-only waste, is now delivering.
Spend eased; the reach tests continue
Spend came down to $5,389 (−14% vs August) across 244,142 impressions at a $1.53 CPC. The two YouTube campaigns continue as a reach test (each logged a low-value conversion), while Main Geo, PMax High-Intent Geo and Secret Beach drew clicks with no booking recorded this month — those clicks may convert later via Direct or Organic. Hold the reach tests one more cycle before judging.
Conversion actions firing in September
| Action | Category | Events | Conv $ |
|---|---|---|---|
| Purchase (Google Ads) | Purchase | 4.00 | $55,532 |
| GA4 purchase (web) | Purchase | 14.00 | $321,453 |
| Form Capture | Default | 61.00 | — |
| Add to Cart | Add to cart | 66.00 | — |
| Phone call (GA4 event) | Phone call lead | 40.00 | — |
Read the Google Ads conversions as Google-reported
Google credits Main (US) and Brand with two bookings worth $55,532, a 10.3× return on $5,389 of spend. As in prior months, these are Google-reported conversions imported into the account (attribution recorded as "unknown"), not independently proven bookings — so read the ROAS as Google's view, strong but modeled. A GA4 conversion cross-check ties ad clicks to actual Hostfully bookings.
Spend vs Google-reported conversion value by campaign — September 2026
ChatGPT Ads — a separate channel test
Impressions in ChatGPT
35,862
inside AI conversations
Website visitors
398
1.1% click-through rate
Tracking
Live
pixel + custom audiences ready for Q4
An early move into AI advertising
Separate from Google Ads, Pure Kauai placed its brand inside ChatGPT conversations with Pacific Coast travelers, our core feeder market. The test drew 35,862 impressions, 398 visitors and a 1.1% click-through rate. Conversion and pixel tracking are now live and custom audiences (past guests, travel industry) are uploaded, so Q4 can measure every inquiry the channel drives and scale what works.
The Story
September saw 9,058 sessions and 17,279 pageviews, down from August in a hurricane-hit month (−26% vs Aug, −6% YoY) as Hurricane Lowell disrupted mid-month travel planning. New users held up better at 6,919 (+5% YoY). GA4-attributed revenue was $321,453 (−41% YoY) on 14 purchases. The intent signals are the real story: form submissions jumped +510% YoY to 61 and phone-call events +233% YoY to 40. The $321K GA4 figure sits well below the booking reality (YTD $8.64M identified) because most luxury stays complete offline with a reservations agent.
Headline web metrics — September 2026
Sessions
9,058
−26% vs Aug · −6% YoY
Pageviews
17,279
−26% vs Aug · −17% YoY
New users
6,919
+5% YoY
GA4-attributed revenue
$321,453
−41% YoY · 14 purchases tracked
Traffic by channel
| Channel | Sessions | Share | YoY vs 2025 |
|---|---|---|---|
| Direct | 2,778 | 30.7% | +5.59% |
| Paid Search | 2,513 | 27.7% | −12.77% |
| Organic Search | 2,499 | 27.6% | +3.87% |
| Cross-network | 539 | 6.0% | — |
| Referral | 242 | 2.7% | — |
| Paid Other | 198 | 2.2% | — |
| Organic Social | 138 | 1.5% | +112% |
| Unassigned | 93 | 1.0% | — |
This month Organic Search is the 3rd channel (behind Direct and Paid Search). Wendy's +41% YoY organic figure is Search Console trailing-3-month; GA4's September organic is +3.87% YoY. Both are shown, each labeled to its source.
Key events — September 2026 (GA4)
Form submits
61
+510% YoY
Phone calls (GA4 event)
40
+233% YoY
Add to cart
66
−24% YoY
Revenue attribution by channel (GA4)
| Channel | Revenue | Share of GA4 rev |
|---|---|---|
| Direct | $147,377 | 45.8% |
| Organic Search | $109,603 | 34.1% |
| Unassigned | $41,890 | 13.0% |
| Paid Search | $22,583 | 7.0% |
| Total (GA4 attributed) | $321,453 | 100% |
Why GA4 revenue ($321K) is far below the booking reality
GA4 attributes $321,453 of revenue to September web sessions. The booking reality is much larger — $8.64M identified YTD — because the Pure Kauai booking lifecycle frequently leaves the website mid-funnel: guests find the estates digitally, then call or email a reservations agent and complete offline. That is the signature of a relationship-driven luxury rental, and it is why Direct ($147K) and Organic ($110K) dominate GA4 attribution while the true revenue is tracked in Hostfully, not GA4.
Where the visitors came from in September
| Top US states | Sessions |
|---|---|
| California | 2,170 |
| Hawaii | 663 |
| Washington | 486 |
| Texas | 404 |
| Oregon | 367 |
| New York | 347 |
| Colorado | 250 |
| Florida | 218 |
| Top countries | Sessions |
|---|---|
| United States | 7,810 |
| Singapore | 311 |
| Canada | 220 |
| China | 84 |
| India | 63 |
| United Kingdom | 61 |
Softer traffic, much stronger intent
September traffic eased (9,058 sessions, −6% YoY) as Hurricane Lowell disrupted mid-month planning, but the high-intent signals accelerated: form submissions +510% YoY (61) and phone-call events +233% YoY (40). Fewer, more serious visitors — and new users still grew +5% YoY. The visibility work is converting to contact, not just clicks.
Revenue soft on the web, strong in the pipeline
GA4-attributed revenue was $321,453 (−41% YoY), roughly flat with August ($324K) in a hurricane-hit month. Web-attributed revenue always understates Pure Kauai's reality; the YTD pace (91% of the $9.5M goal) and the $2.18M forward pipeline are where the strength shows, with most bookings closing offline.
The Story
Social found its rhythm in Q3: 220K+ views across Facebook and YouTube, Instagram publishing up 324.6% over Q2, and +50 new YouTube subscribers (147 total, +233%). Local-knowledge content travels furthest — "Top 6 Kauai Beaches" drew 45.8K views and 1.2K shares — and the homes are the hook, with the Pure Kauai Tours playlist driving 67K of YouTube's views. Facebook and YouTube view totals include paid promotion. Each channel is broken out below with its Meta Business Suite and YouTube Studio detail.
Channel comparison — Q3 2026
| Channel | Views | Reach / Viewers | Highlight |
|---|---|---|---|
| YouTube | 120.7K | 775 watch hrs | +50 subs · 8.1% CTR |
| 101K | 73,146 viewers | 62K organic + 39K ads | |
| 242 posts | +324.6% vs Q2 | "Top 6" 45.8K / 1.2K shares |
Facebook and YouTube view totals include paid promotion. Window: Q3, Jun 30–Sep 27.
InstagramQ3 2026 · 242 posts (+324.6% vs Q2) · "Top 6 Kauai Beaches" 45.8K views / 1.2K shares
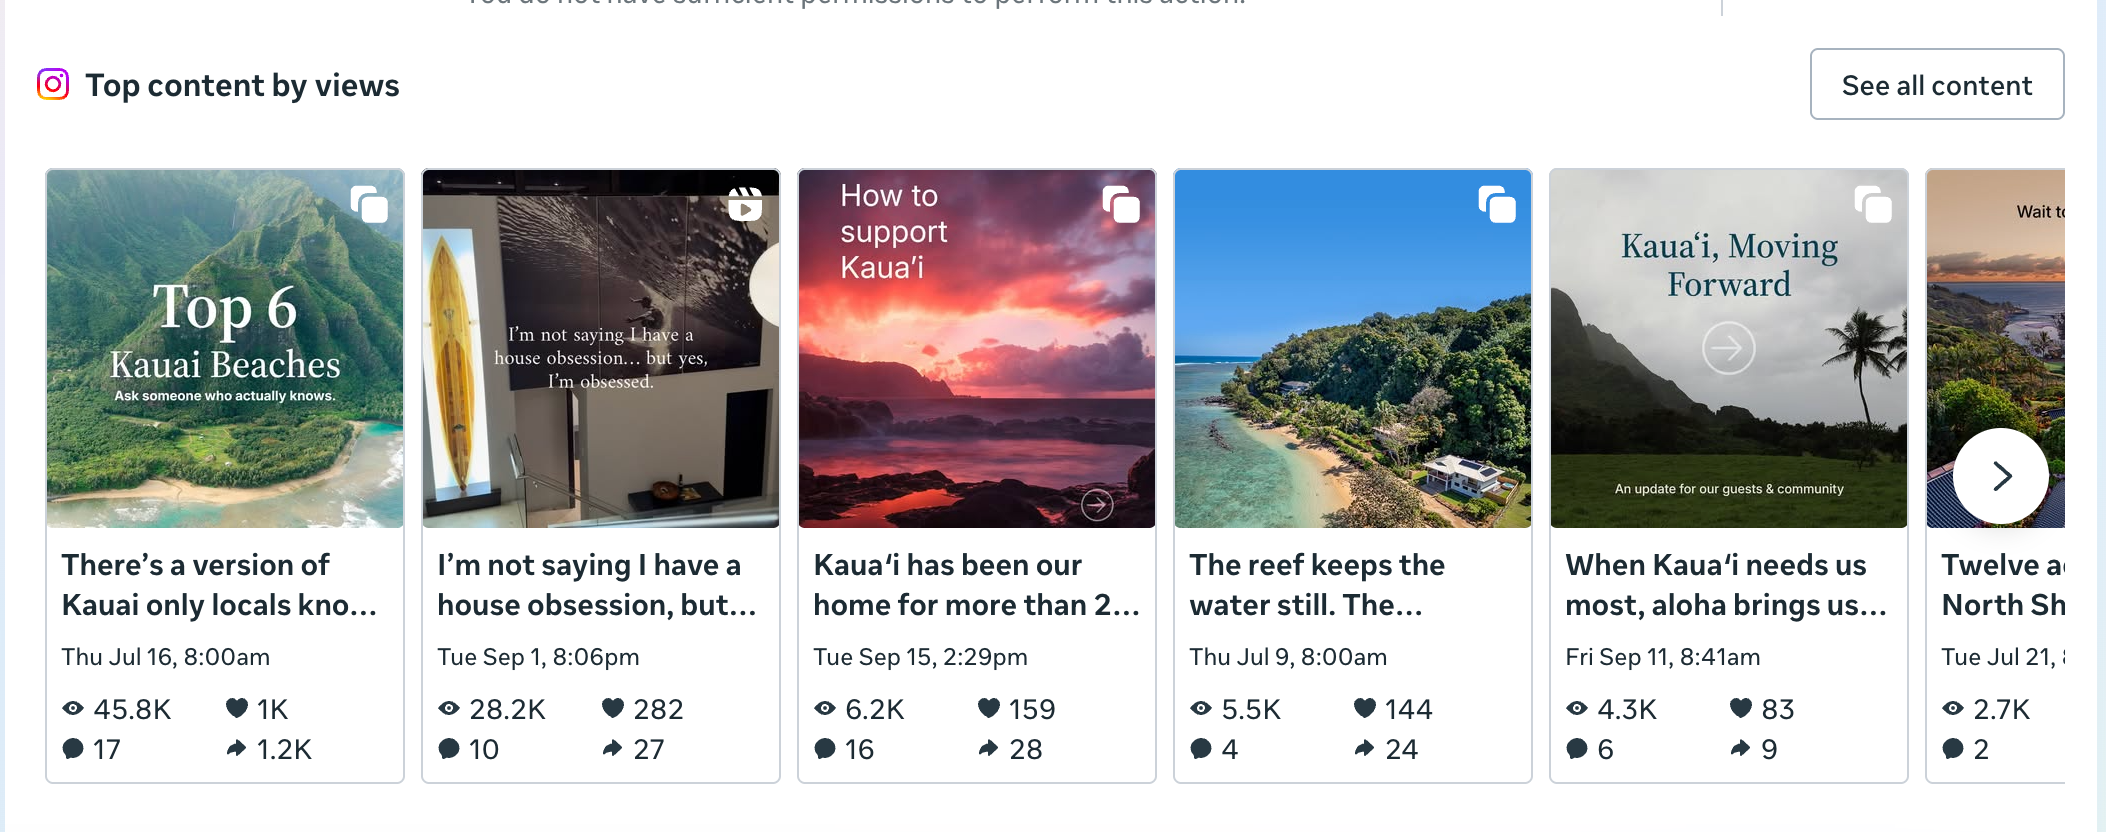
Instagram top content by views (Meta Business Suite)
Published content — formats
| Format | Pieces published |
|---|---|
| Stories | 173 |
| Posts (feed & reels) | 69 |
| Total published | 242 · +324.6% vs Q2 |
Useful, local-knowledge content travels furthest
"Top 6 Kauai Beaches" earned 45.8K views and 1.2K shares, more than ten times the shares of the next four top posts combined — guests save and send content that helps them plan. The top home reel reached 28.2K views. Instagram publishing rose 324.6% over Q2 (173 stories, 69 posts), and after Hurricane Lowell the "Support Kauai" and "Moving Forward" community posts earned strong engagement with no villas shown.
FacebookQ3 2026 · 101K views · 73,146 viewers · 4.4K interactions · 4d 16h watch
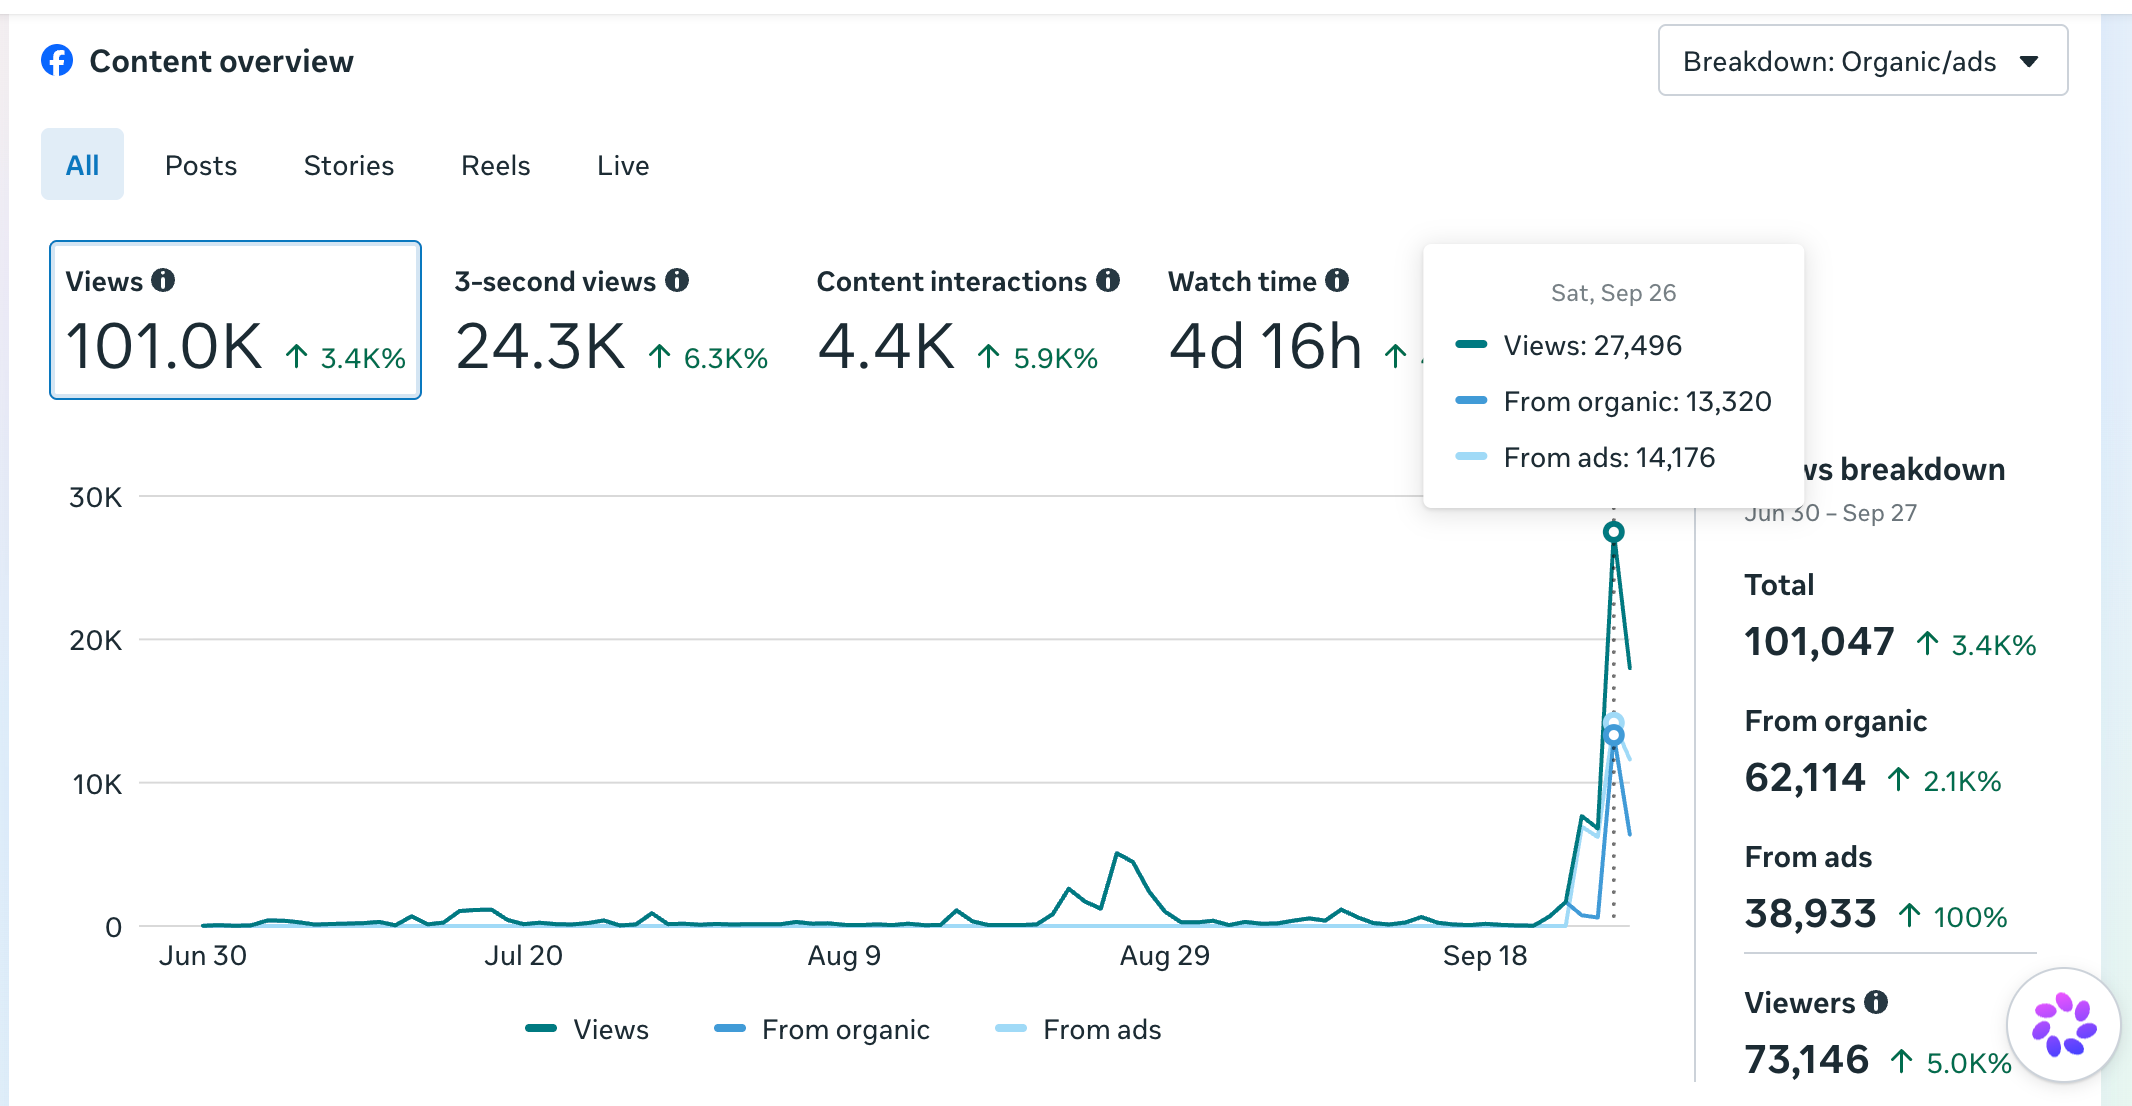
Facebook content overview (Meta Business Suite)
Facebook is the quiet win
101K content views (62,114 organic + 38,933 from boosted reach), 73,146 viewers, 4.4K interactions and 4 days 16 hours of watch time. The late-September spike — Sept 26 alone pulled 27,496 views — came from boosting the “Support Kauaʻi” community post. The same estate creative that runs on Instagram and YouTube earns incremental reach here at no extra production cost.
YouTubeQ3 2026 · YouTube Studio · last 90 days
Views
120.7K
>999% vs prior 90 days
Watch time
775.3 hrs
>999% vs prior 90 days
Subscribers
+50
147 total · +233% vs prior 90 days
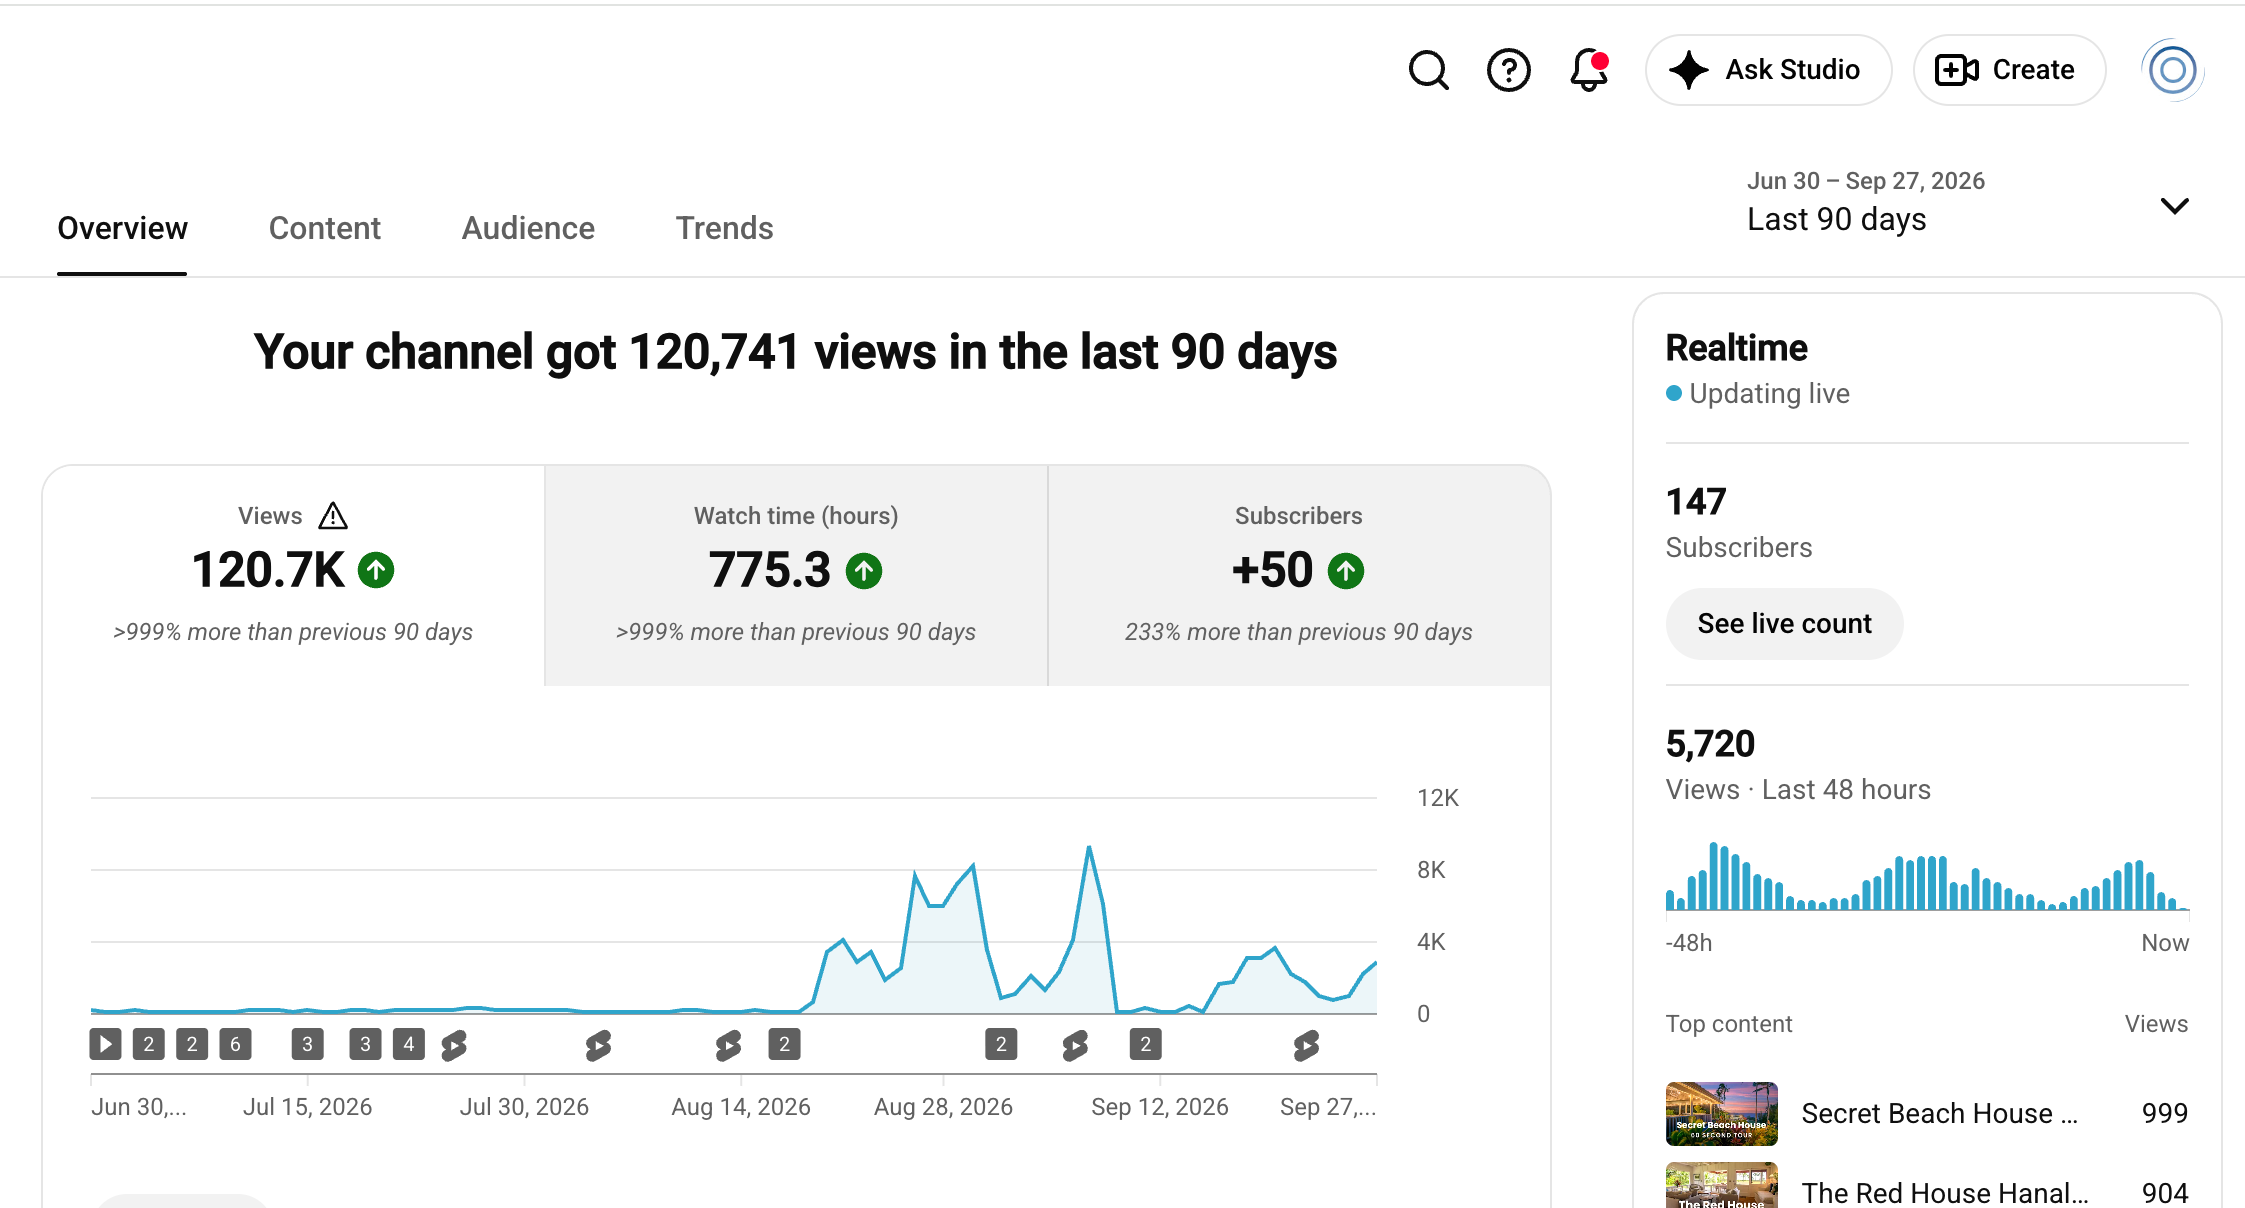
YouTube Studio overview
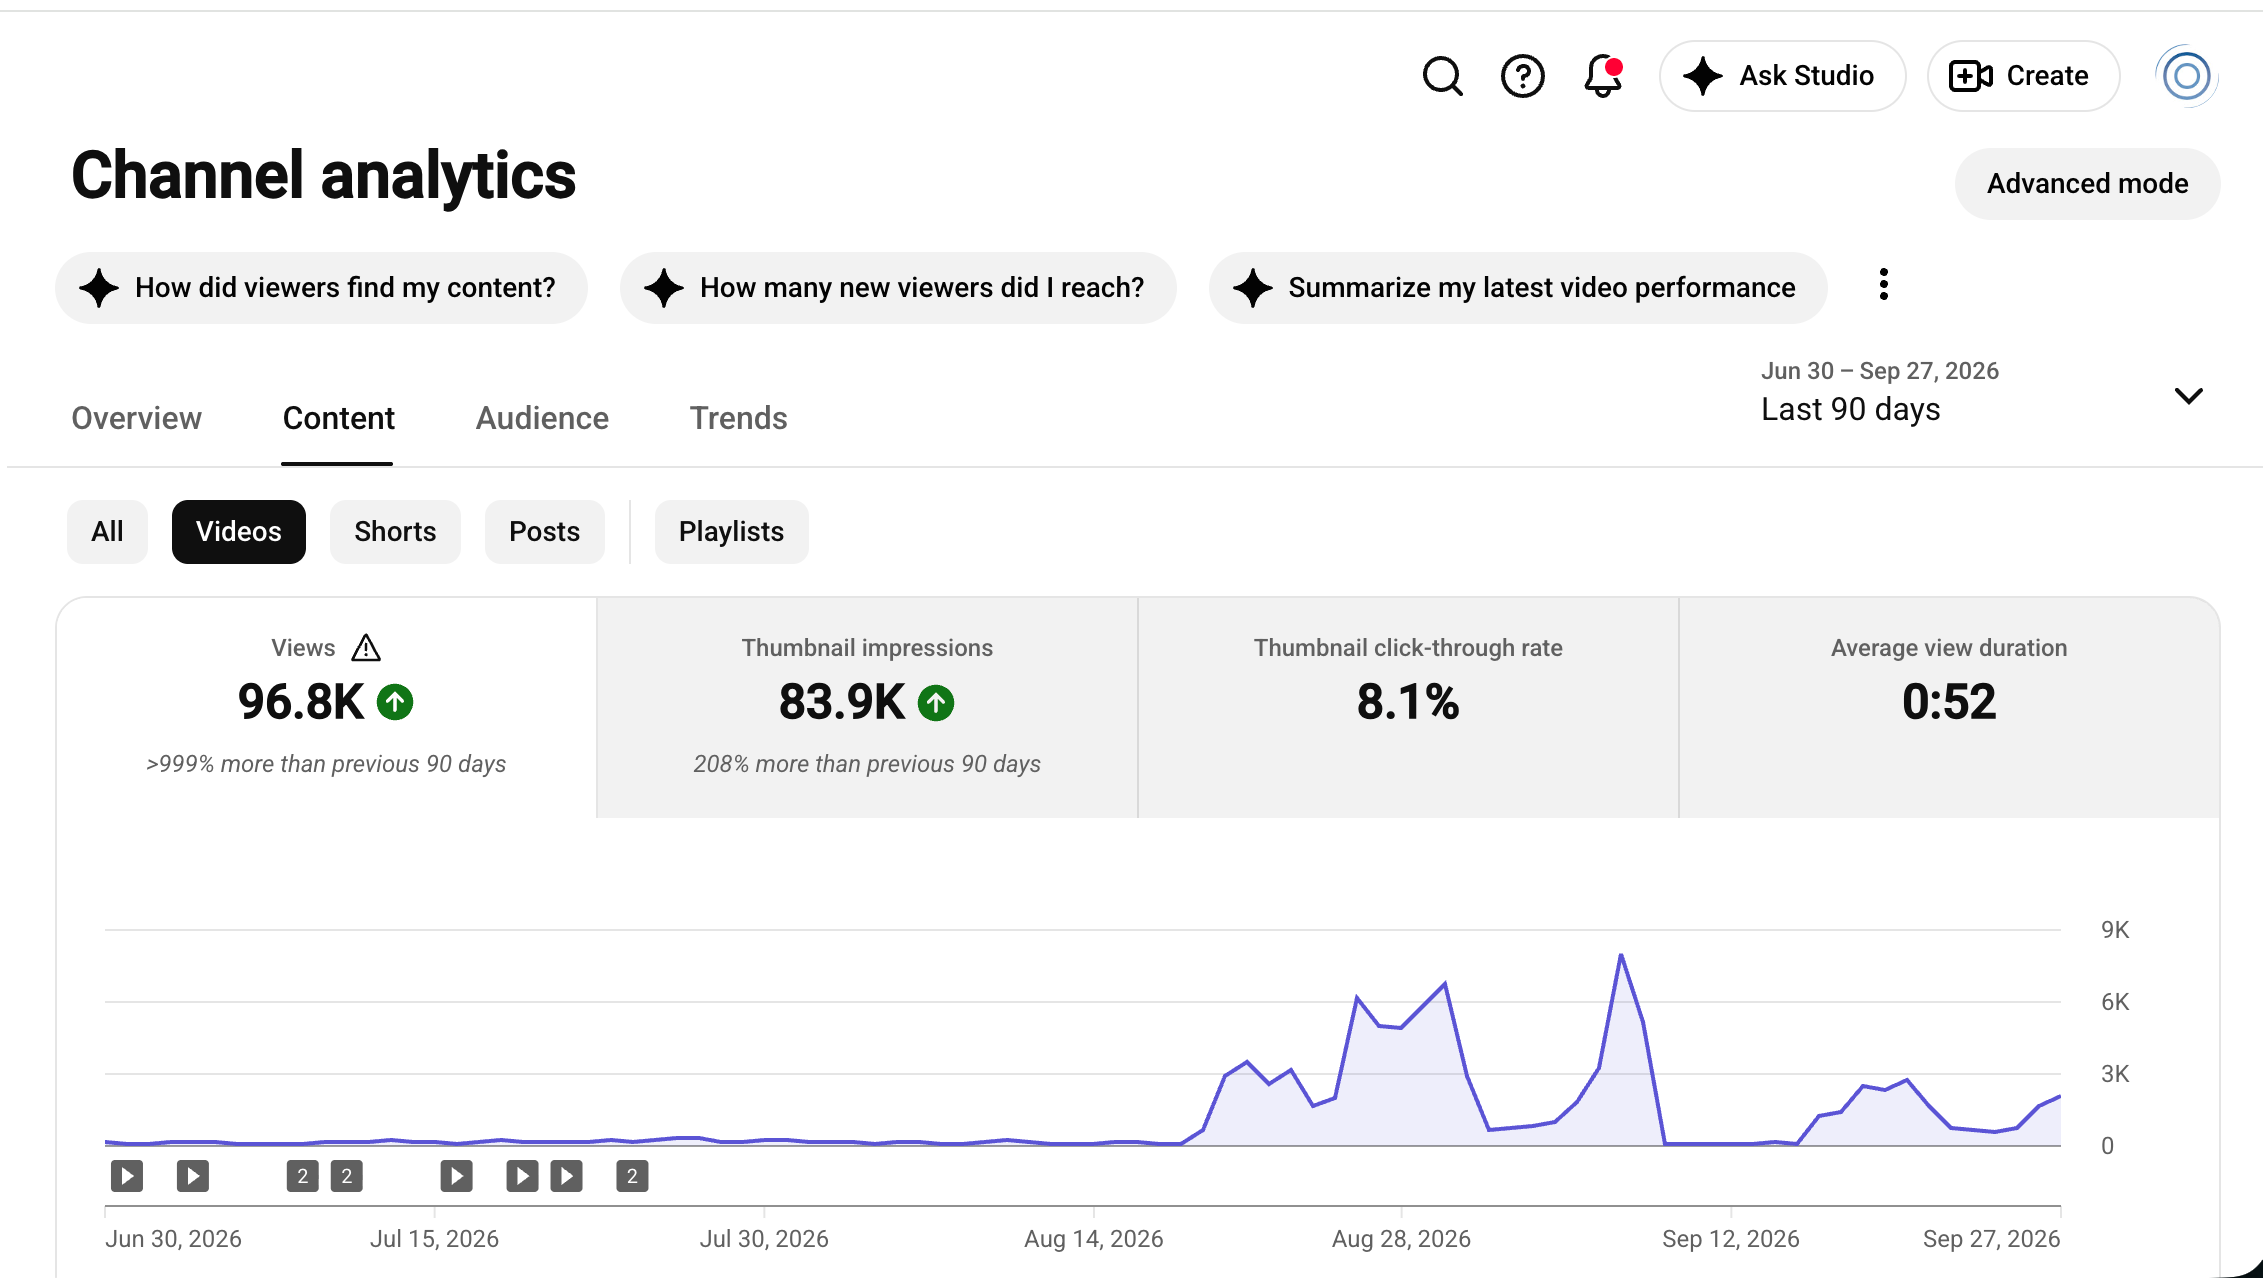
YouTube content performance (videos)
Top YouTube content (by views)
| Content | Views | Read |
|---|---|---|
| Pure Kauai Tours (playlist) | 67,119 | The channel engine — estate walkthroughs |
| Pure Kauai Collection (playlist) | 29,557 | Signature-home highlights |
| Shorts | 23,700 | 6.4K engaged · short-form discovery |
| Long-form (new viewers) | 25.3K of 30K+ | drove 38 of 50 new subscribers |
Home tours are the engine
120.7K views, 775 hours watched, an 8.1% thumbnail click-through rate on 83.9K impressions, and a 0:52 average view. The Pure Kauai Tours playlist alone pulled 67,119 views (the Pure Kauai Collection added 29,557). Long-form videos drove 25.3K of 30K+ new viewers and 38 of the 50 new subscribers; Shorts added 23.7K views. People are watching the homes — the Q4 focus is giving them a reason to subscribe.
Viewers aren't yet followers — the Q4 opportunity
120.7K views and an 8.1% thumbnail click-through rate prove the homes pull attention, but only 50 of those viewers subscribed and the average view is 0:52. The gap between reach and retention is the clearest Q4 lever: end screens, subscribe prompts and a stronger first ten seconds should convert more of this reach into a returning audience. Note the Q3 Facebook and YouTube view totals include paid promotion, so read them as reach, not pure organic growth.
Needs attention now
- Finish the ad-to-booking cross-check. Google Ads reports 4 conversions worth $55,532 and the ChatGPT test adds 398 visitors, but both are platform-reported with attribution recorded as "unknown." Tying ad clicks to actual Hostfully bookings is the highest-leverage measurement task still open.
- Shorten the path to Contact. The booking flow still takes several clicks to reach a human; a one-click contact or the in-app concierge on every property and booking page remains the highest-leverage UX fix for turning high-intent visitors into inquiries.
Watch this month
- Hurricane Lowell softened Q4 bookings. Forward-booked eased to $2.18M (from $2.41M on the Sep 3 cut); watch the rebooking pace and keep the warm Facebook and Instagram audience engaged with villa and concierge content.
- Turn viewers into subscribers. 120.7K YouTube views converted to only 50 new subscribers — add subscribe prompts, end screens and pinned comments, and tighten the first 10 seconds to lift the 0:52 average view.
- Keep the publishing cadence up. 30+ approved blog posts are ready — getting them all live in Q4 is what keeps organic and AI search compounding.
Going well
- Organic search is surging — +41% YoY (Search Console), $109,603 GA4-attributed revenue on zero media spend, built on the Island Guide; GA4 organic sessions +3.9% YoY.
- AI is recommending us — 539 AI answers cite our content (89% from the Island Guide), and AI visitors spend 85% more time on site than average.
- Calls up +233% YoY (40), with Google Ads driving 20 and three new call sources appearing this month.
- Social found its rhythm — 220K+ views across Facebook and YouTube, +50 YouTube subscribers, Instagram publishing +324.6% over Q2.
- Revenue held a resilient 91% pace through a hurricane-affected quarter, $383K ahead of 2025 in absolute dollars.
Q4 plan & targets
- Content & search: publish all 30+ approved blog posts, including new ultra-high-net-worth topics (flying private to Hawaii, with GO Rentals and Amalfi Jets). Target: organic +20% or more YoY, AI citations 539 → 650.
- Grow the warm audience: re-engage past guests and recent villa browsers through owned channels (email, newsletter) and the tracked ad channels.
- ChatGPT ads: expand spend and creative on the stronger tracking foundation, focused on high-intent Pacific Coast travelers.
- Target: inquiries from paid ads 284 → 340 (+20%).