A strong October: 91.4% to the annual goal, website traffic back up 24%, and paid scaled for peak season.
Identified revenue reached $8.69M, $319K ahead of last year; Google Ads scaled 69% into the Oct–Mar peak; and form inquiries are up 571% year over year. This one page is the whole story; tap any channel card to open its full report.
Key performance numbers
Identified revenue
$8.69M
91.4% of $9.5M goal↑ +$319K YoY
Bookings (identified)
338
↑ +17% YoY289 in 2025
Website sessions
11,243
↑ +24% MoM↑ +1% YoY
Inquiries (Oct)
132
94 forms · 38 calls↑ forms +571% YoY
Revenue & booking pace
Identified revenue against the $9.5M annual goal
$8.69M · 91.4%
$812K to goal$2.10M forward booked · 60 stays
20262025Accommodations revenue by check-in month
Jan
Feb
Mar
Apr
May
Jun
Jul
Aug
Sep
Oct
Nov
Dec
Channel performance · tap for details
Where we're winning
↑
Traffic rebounded +24%
Website sessions recovered to 11,243, with form inquiries up 571% year over year.
↑
Calls +124% YoY
Google Ads drives 42% of calls, and Google Organic calls jumped 8x year over year.
↑
Revenue +$319K
Identified revenue $8.69M, ahead of the same point in 2025, at 91.4% of goal.
Marketing budget focus
Sustain
Peak-season ads
Now at $9,130/mo; hold near $10K through Oct–Mar while CPC stays around $1.56.
Rebuild
Organic & Island Guide
Organic softened to 2,185 sessions; publish the 30+ ready articles to compound it back.
Improve
Conversion & PMax
Performance Max is 27% of spend with no tracked conversions — review before scaling further.
Top three priorities
1
Publish the Island Guide
Ship the 30+ ready articles to compound organic and AI search demand.
2
Sustain peak-season ads
Hold Google Ads near $10K/mo through Oct–Mar and review Performance Max efficiency.
3
Launch Meta & partners
Start targeted Meta campaigns and expand luxury travel-advisor relationships.
October was a deliberate peak-season scale-up: spend rose to $9,130 (+69% MoM) with CPC steady at $1.56 and impressions up 83%. Framed as ad spend against real direct bookings, not modeled ROAS. Meta Ads pending account access; it slots in beside Google once granted.
Spend & return
Ad spend (Oct)
$9,130
↑ +69% MoMpeak-season scale-up
Revenue per ad $1
$102
↑ +40% YoYQ3, Google-reported
Ad $ per direct booking
$346
−26% YoYmore efficient
Direct booking revenue
$1.80M
↑ +2% YoYQ3 2026
Monthly spend · 2026
Google Ads spendJan–Oct 2026, Google-reported
Jan
Feb
Mar
Apr
May
Jun
Jul
Aug
Sep
Oct
Month
Spend
Clicks
CPC
January
$7,768
4,150
$1.87
February
$9,097
4,204
$2.16
March
$9,252
4,618
$2.00
April
$6,477
2,835
$2.28
May
$6,096
3,195
$1.91
June
$7,103
3,974
$1.79
July
$6,007
2,546
$2.36
August
$6,240
3,949
$1.58
September
$5,393
3,523
$1.53
October
$9,130
5,845
$1.56
Quarter by quarter
Quarter
2025
2026
YoY
Q1 · Jan–Mar
$20.3K
$26.1K
+28%
Q2 · Apr–Jun
$23.0K
$19.7K
−14%
Q3 · Jul–Sep
$24.3K
$17.6K
−27%
Q4 · Oct so far
$23.9K
$9.1K
in progress
Year to date (Jan–Oct), Google Ads spend is $72.6K in 2026 vs $76.4K in 2025, about 5% leaner while bookings rose. Spend concentrates into the Oct–Mar peak, so Q4 builds from October.
Q3 revenue efficiency, year over year
Metric
Q3 2025
Q3 2026
Change
Google Ads spend
$24.3K
$17.6K
−27%
Direct booking revenue
$1.77M
$1.80M
+2%
Ad $ per direct booking
$467
$346
−26%
Revenue per ad $1
$73
$102
+40%
Running campaigns · month over month
Campaign
Aug
Sep
Oct
MoM
Search · Main Geometros
$1,596
$1,375
$3,040
+121%
Search · Main (US)
$2,466
$2,125
$2,584
+22%
Performance Max · Geo
$1,010
$962
$2,472
+157%
YouTube · Views
$392
$417
$612
+47%
Search · Secret Beach
$604
$337
$273
−19%
Search · Brand
$172
$169
$119
−30%
YouTube · Reach
$1
$9
$33
ramping
At a $1.56 cost per click, Google Ads drove 16 inbound calls in October, 42% of all tracked calls and the month's top call source. BookingBridge tags each paid click with a click-ID, tracing inquiries back to the exact ad and campaign.
Fewer organic visits, but the most valuable ones. Organic traffic was seasonally softer in October, yet it still drove 3 of the month's 10 online purchases (30%), nearly double its 19.4% share of traffic, and organic callers stayed on the phone roughly three times longer than paid callers. The Island Guide hub keeps doing the heavy lifting.
Plain English: a session is one visit to the website. Organic sessions are the visits that came from unpaid Google and AI search, with no ad spend behind them, so they show how well the site earns attention on its own.
Organic sessions
2,185
19.4% of traffic
Organic purchases
3 of 10
30% of online purchases
SEO pageviews
3,474
Island Guide driven
ChatGPT visits
71
↑ +12 MoMAI search
What visitors read
Top organic landing pages in October, all from the Island Guide hub.
Where organic sits in the traffic mix
Organic search is the site's third-largest channel, at 19.4% of all sessions.
Organic & AI visitors are the most engaged
Average inbound call length by source. Organic and AI callers stay far longer than paid or direct.
Month over month & year over year
Metric
September
October
YoY
Organic sessions
2,499
2,185
−32%
SEO pageviews
4,754
3,474
−34%
Online purchases from organic
—
3 of 10
30% share
Traffic volume is down year on year, but conversion quality held up: organic turned fewer visits into a larger share of purchases.
The Island Guide keeps driving organic: top reads were "best month to go to Kauai" (589 views) and "where to see turtles" (286). ChatGPT sent 71 visits this month (+12 MoM), and AI-assistant visitors engage 54% longer than the site average.
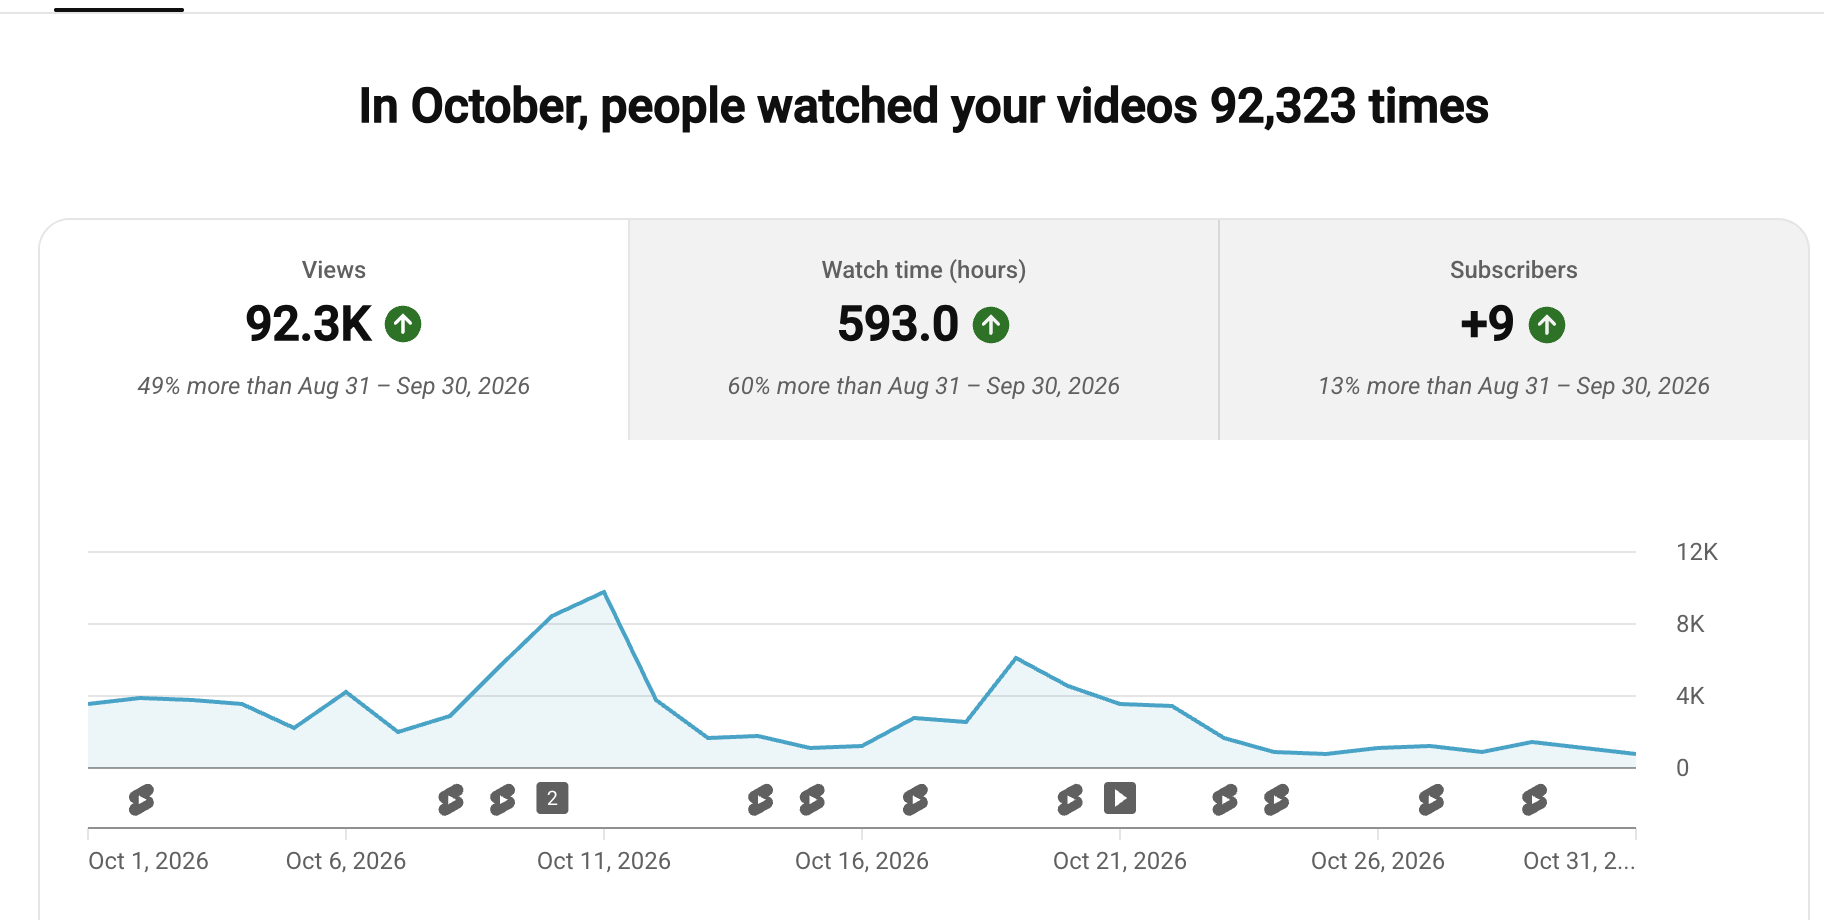
Pure Kauai's strongest organic social month of the year. 217.7K combined views across Facebook, Instagram and YouTube, with every platform up by double digits month over month. Facebook and YouTube each cleared 90K views, and interactions grew fastest of all (Facebook up 76%).
Facebook views
98.0K
↑ +27% MoM
Instagram views
27.3K
↑ +76% MoM
YouTube views
92.3K
↑ +49% MoM
All platforms
217.7K
total views in October
Facebook
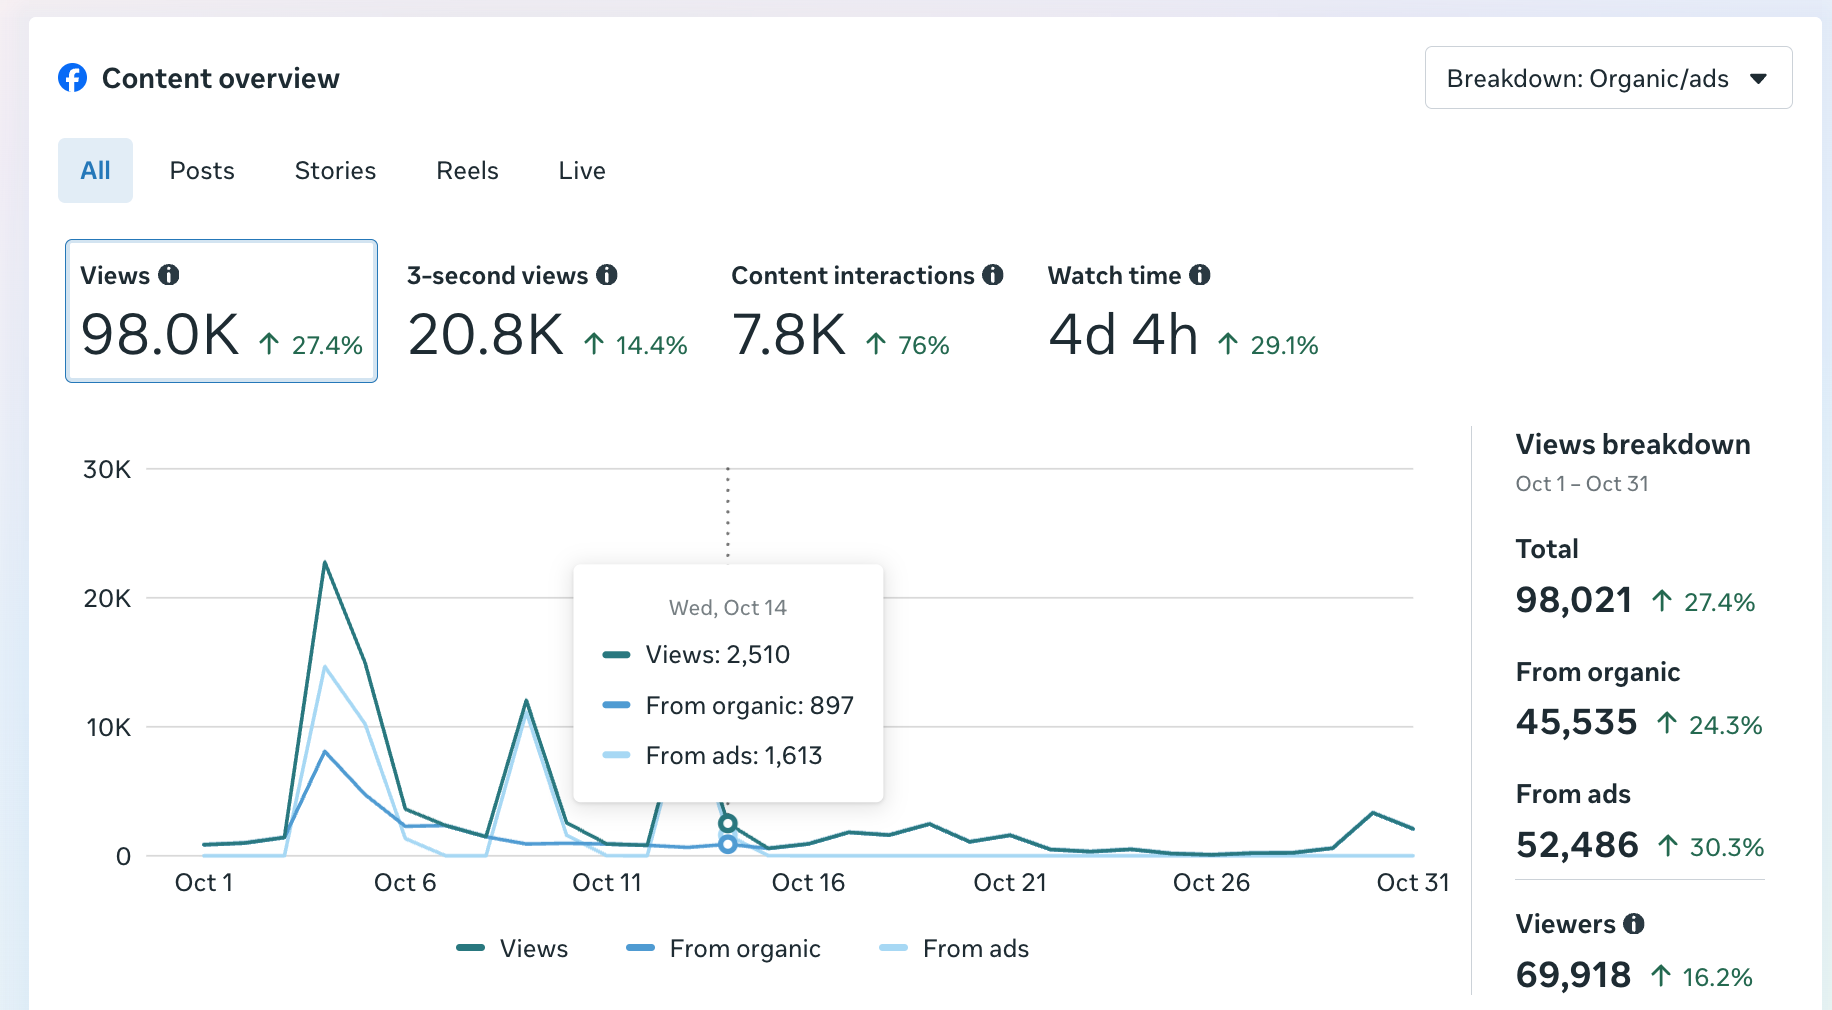
Oct 1–31. 98.0K views, up 27% on September, and the fastest interaction growth of any channel.
Views
98.0K
↑ +27%
Viewers
69,918
↑ +16%
Interactions
7.8K
↑ +76%
Watch time
4d 4h
↑ +29%
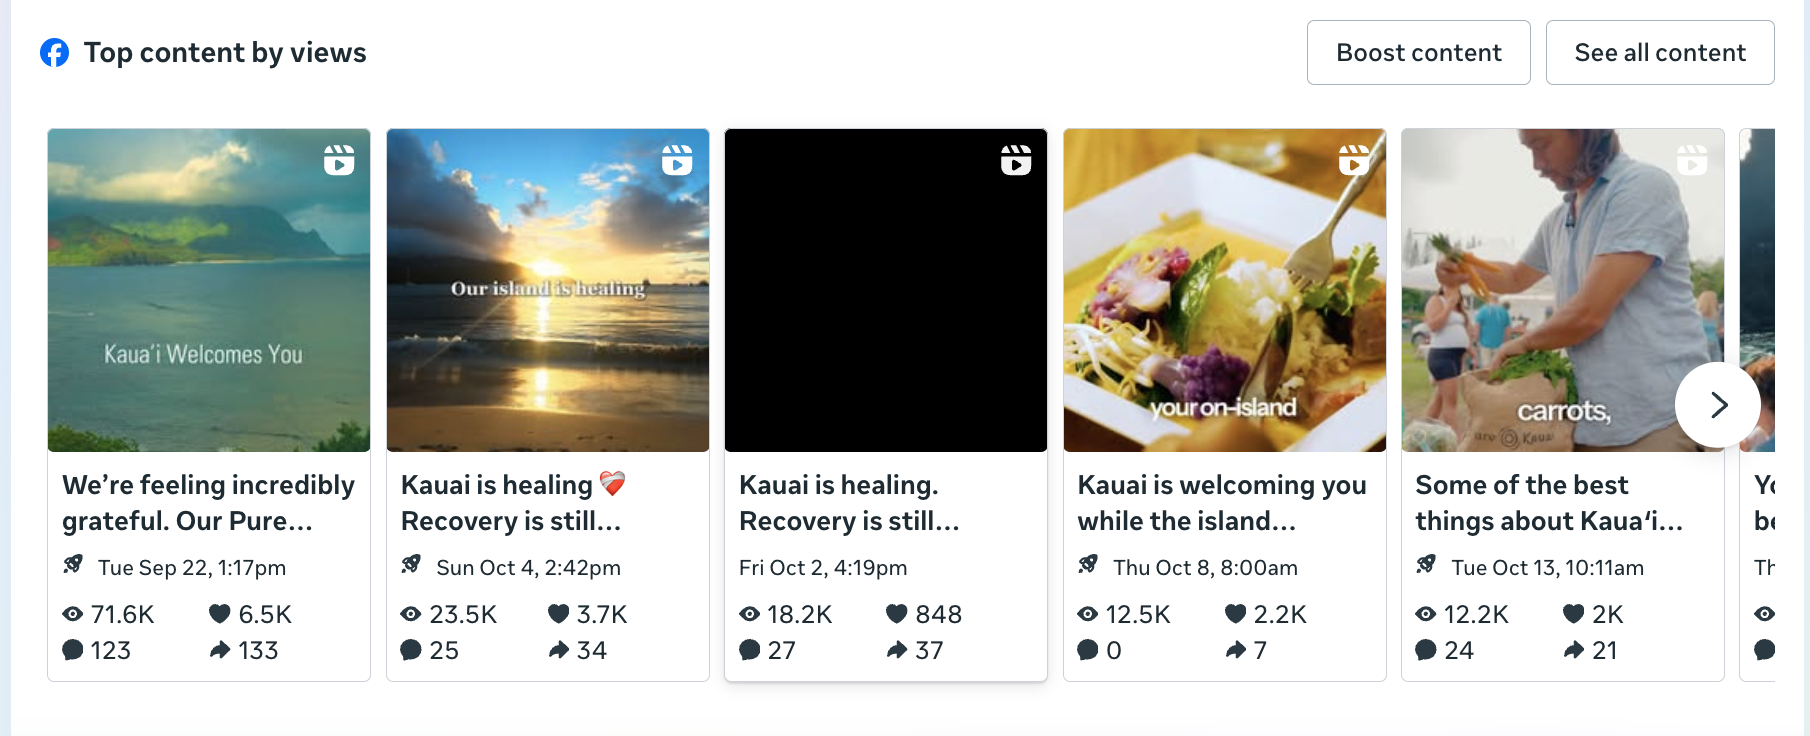
Views split 45.5K organic and 52.5K boosted. The top post, "Kauai is welcoming you," reached 71.6K views, with the 25-year anniversary posts close behind.
Facebook · October overviewFacebook · top content
Instagram
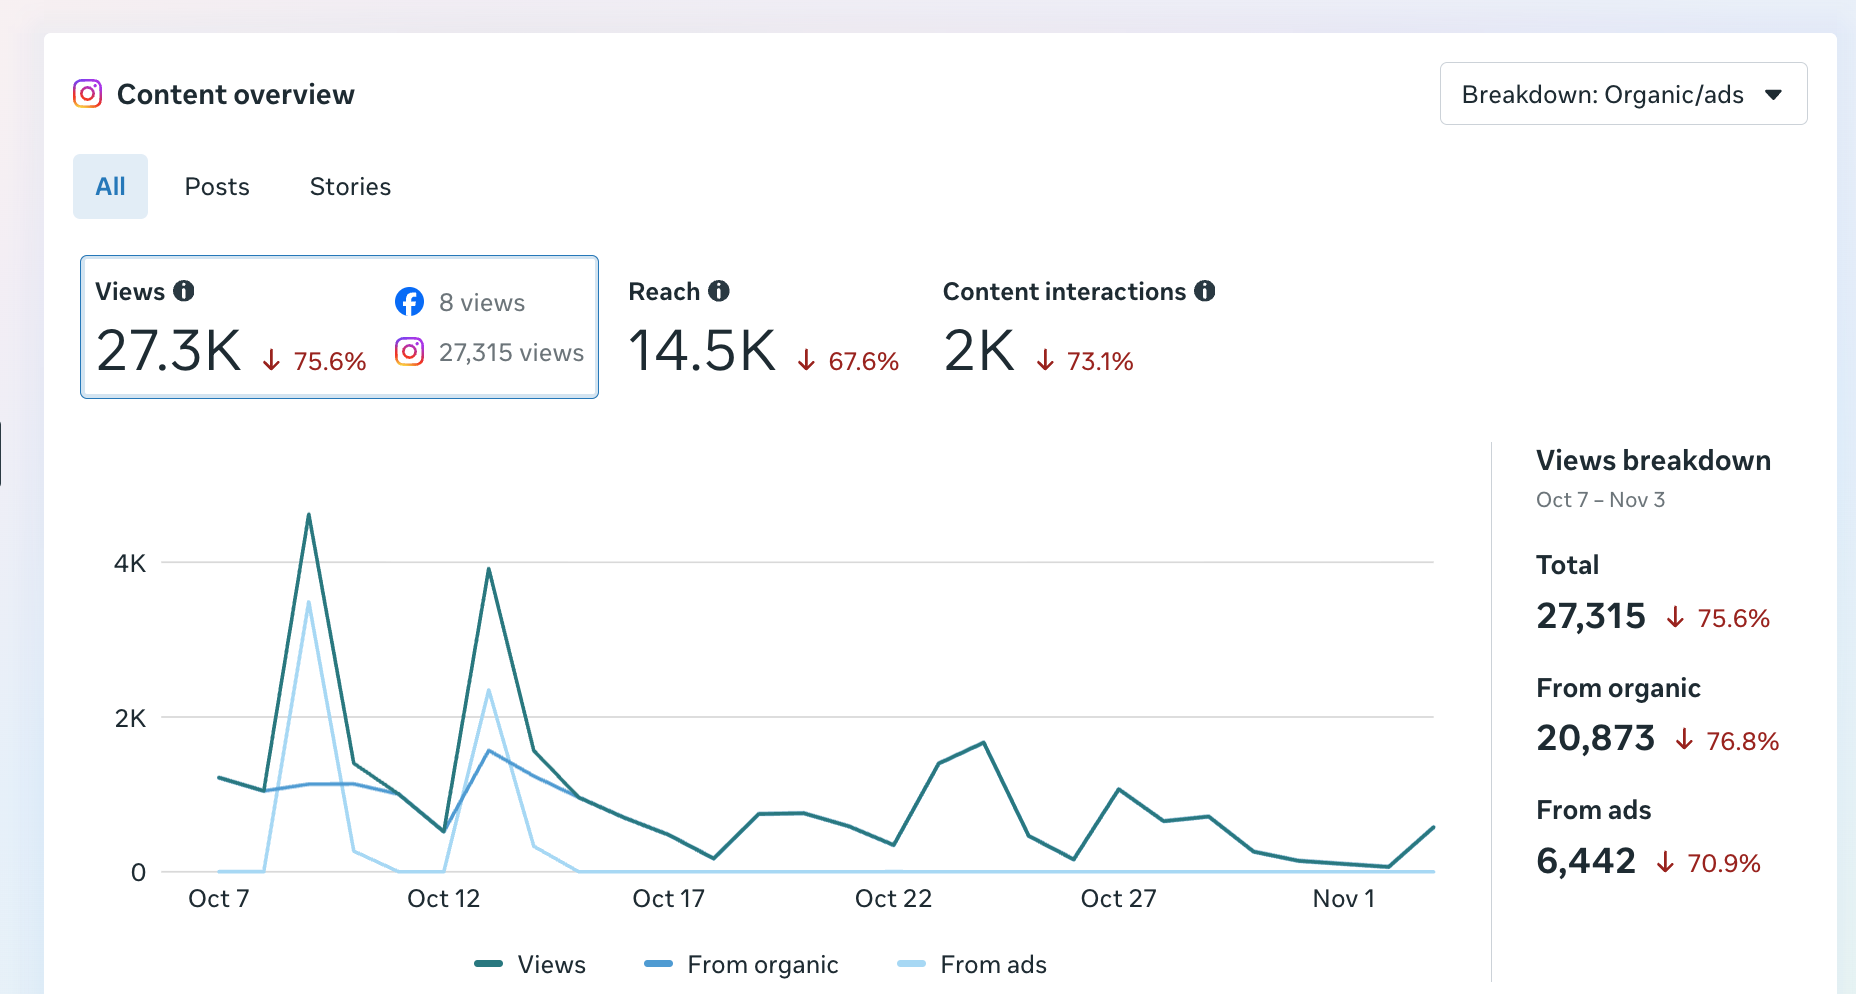
Oct 7–Nov 3. 27.3K views, up 76%, led by organic reach.
Views
27.3K
↑ +76%
Reach
14.5K
↑ +68%
Interactions
2.0K
↑ +73%
Organic share
77%
of all views
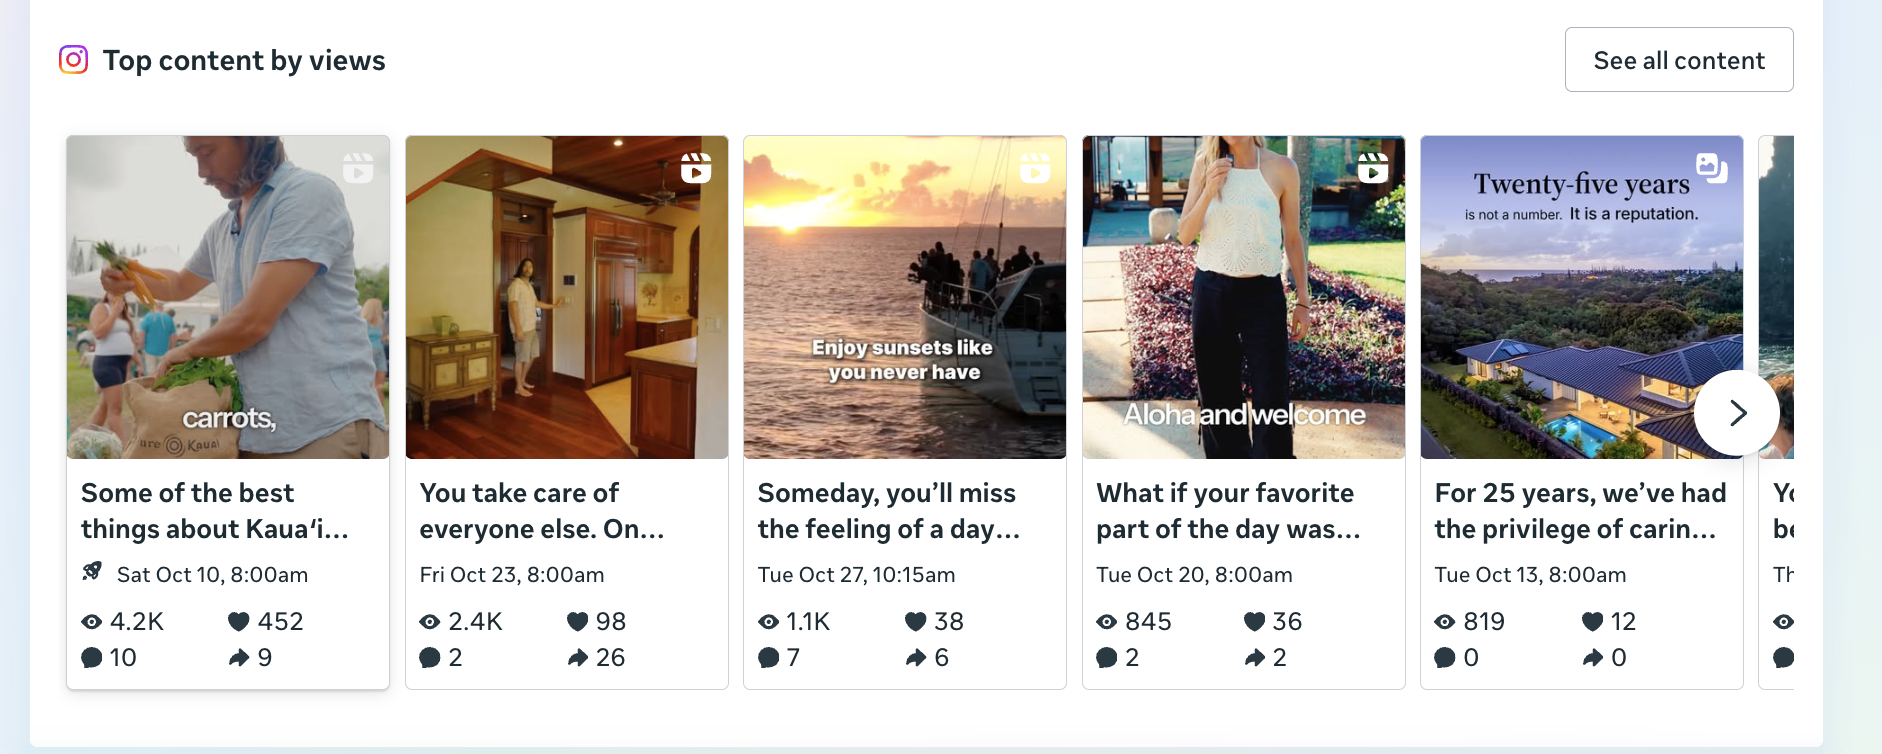
Views split 20.9K organic and 6.4K boosted. Top posts were the "best things about Kaua'i" reel (Oct 10, 4.2K) and the 25-year anniversary series.
Instagram · October overviewInstagram · top content
YouTube
Oct 1–31. 92.3K views and 593 watch hours, both up 50% or more on September.
Views
92.3K
↑ +49%
Watch time
593 hrs
↑ +60%
Monthly viewers
~20K
unique
New subscribers
+9
↑ +13%
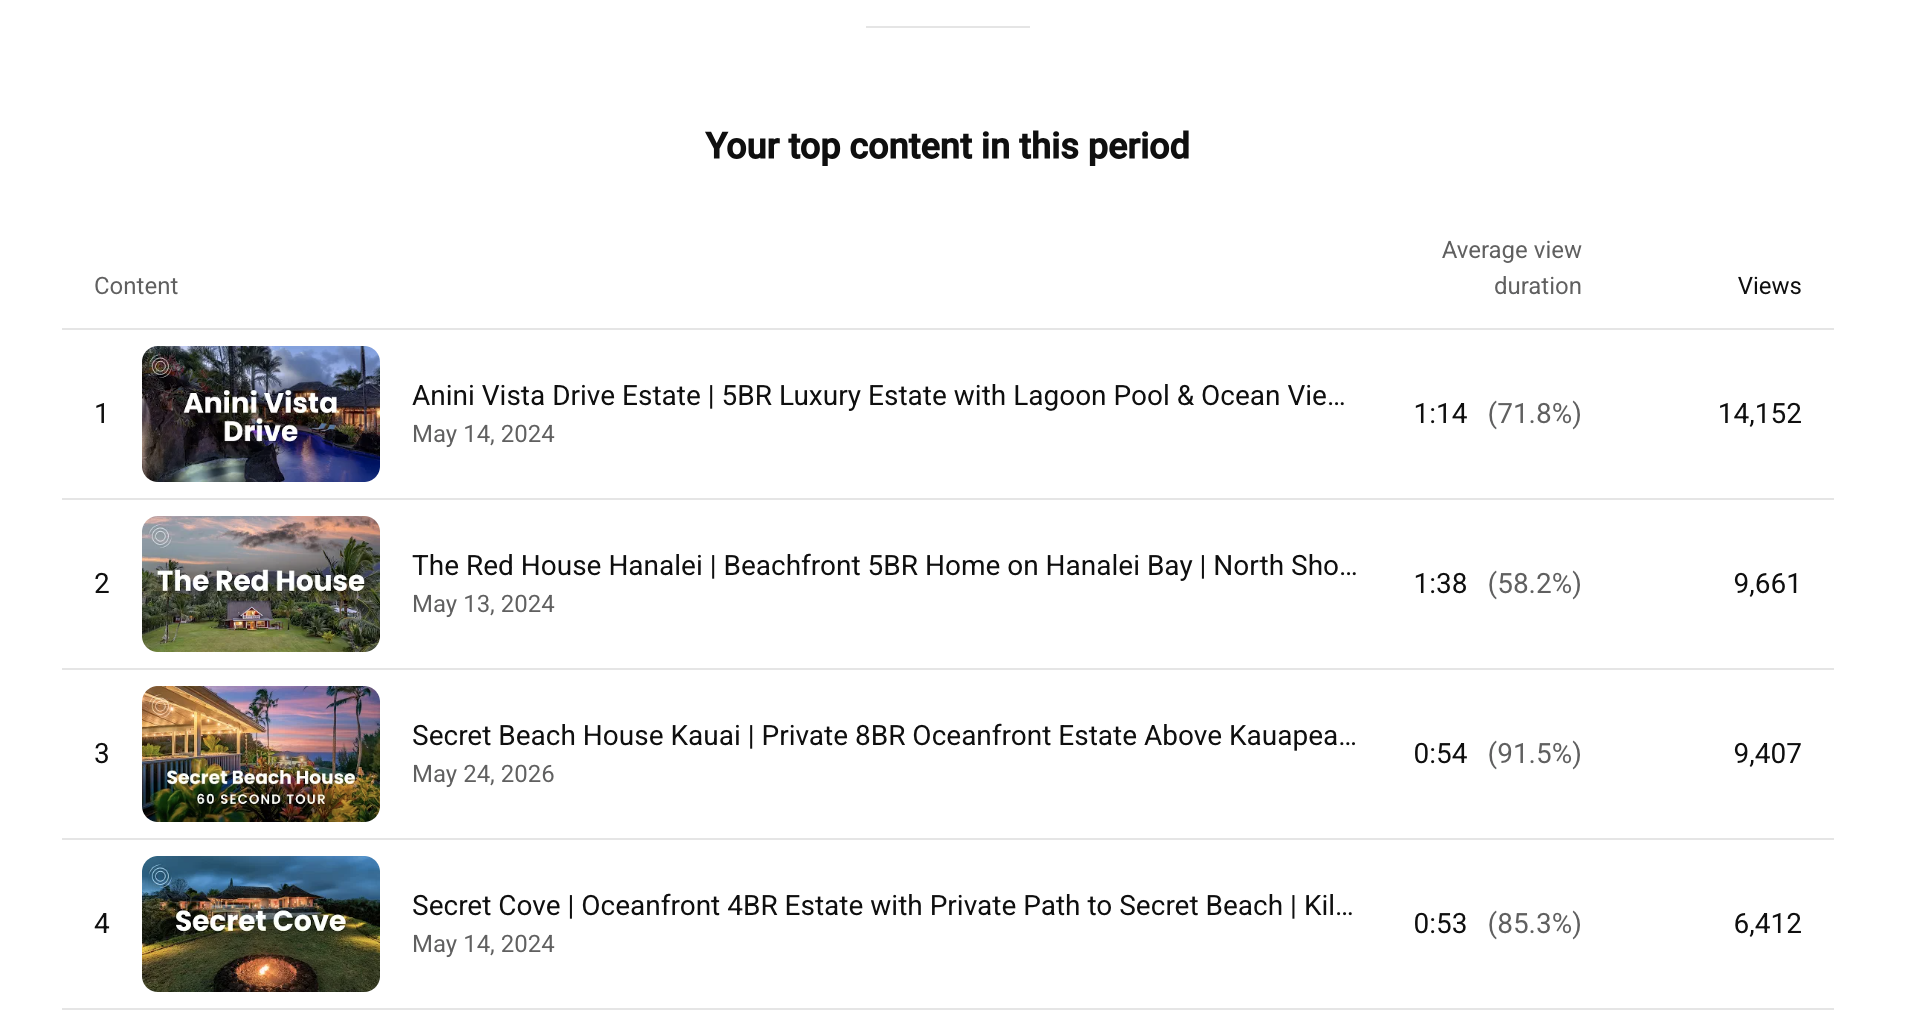
Long-form video drove 67.7K views at a strong 9.6% click-through rate; Shorts added 24.6K. The top video was the Anini Vista Drive Estate tour with 14,152 views (71.8% average view).
YouTube · channel overviewYouTube · top videos
Facebook and Instagram totals include a boosted (paid) layer. A dedicated Meta Ads breakdown with spend and cost per result lands here once account access comes through.
Identified revenue
$8.69M
91.4% of goal
Completed YTD
$6.58M
278 stays
Forward booked
$2.10M
60 future stays
vs 2025
+$319K
same point last year
Pace to the $9.5M goal
$8.69M · 91.4%
$812K to goalGoal $9.5M
Cumulative revenue 2026 vs 2025
Running total of accommodations revenue by check-in month, against the $9.5M goal. Oct–Dec is the booked quarter to date; 2023 and 2024 light up once monthly history is loaded. Tap a legend label to toggle a line.
Flash Report — identified revenue by year
Metric
2023
2024
2025
2026
Completed trip revenue
$6.41M
$6.13M
$6.57M
$6.58M
Booked for rest of year
$1.73M
$1.59M
$1.80M
$2.10M
Identified revenue
$8.14M
$7.72M
$8.37M
$8.69M
Full-year goal
$9.5M
$10.0M
$9.0M
$9.5M
% of goal
85.7%
77.2%
93.0%
91.4%
Identified trips
292
314
289
338
Accommodations revenue by check-in month
Month
2026
2025
YoY
January
$309,807
$396,977
−22%
February
$388,913
$397,776
−2%
March
$1,119,490
$1,199,746
−7%
April
$455,523
$830,609
−45%
May
$788,203
$356,398
+121%
June
$1,094,761
$1,158,824
−6%
July
$1,473,025
$1,250,699
+18%
August
$737,345
$738,237
−0.1%
September
$157,711
$177,150
−11%
Oct–Dec (booked)
$2,266,956
$2,522,141
−10%
Inbound calls
38
↑ +124% YoYvs 40 in Sep
Unique callers
28
↑ +27% MoM↑ +87% YoY
From Google Ads
16
↑ +100% YoY42% of calls
Google Organic calls
9
↑ +800% YoY
Month over month & year over year
Period
Inbound calls
vs October 2026
October 2026
38
this month
September 2026
40
−5% month over month
October 2025
17
+124% year over year
Calls held steady month over month (40 to 38) while more than doubling year over year (+124%), with Google Ads and Google Organic the two biggest drivers.
Where the calls came from
Source
Calls
YoY
Read
Google Ads
16
+100%
42% of all calls
Direct
9
+50%
Repeat & referral
Google Organic
9
+800%
Island Guide readers
SearchGPT
2
new
AI search
purekauai.com
1
new
Direct site
Instagram
1
new
Social
Phone calls are where luxury stays close. Google Ads drives 42% of them, Google Organic calls jumped 8x year over year, and SearchGPT appeared as a new AI-search source.
Sessions
11,243
↑ +24% MoM↑ +1% YoY
New users
8,795
↑ +27% MoM↑ +9% YoY
Form submits
94
↑ +571% YoY
Phone events
38
↑ +124% YoY
Where traffic came from
Channel
Sessions
Share
YoY
Paid Search
3,791
33.7%
+7.1%
Direct
3,046
27.1%
−14.5%
Organic Search
2,185
19.4%
−32.1%
Cross-network
1,523
13.5%
+221%
Organic Social
125
1.1%
+178%
Referral + other
557
5.0%
—
Top states & GA4 revenue by channel
Top states
Sessions
California
3,281
Hawaii
768
Washington
610
Texas
553
Oregon
407
GA4 revenue by channel
Revenue
Unassigned
$192,386
Direct
$100,836
Organic Search
$37,741
Paid Search
$31,388
Referral
$8,093
Total
$370,444
GA4 attributes $370K to web sessions this month; the real booking total is far larger ($8.69M identified YTD) because most luxury stays close offline by phone or email. Sessions recovered to 11,243 (+24% MoM), led by Paid Search.