📊
Full Page Report — May 2026
This is the deep-dive companion to the May summary. The pacing view we built is in the Revenue Pacing tab and Cody's current Deep Dash + Flash Report screenshots are mirrored as their own tab. Both are placeholders until the daily automated Hostfully pull ships.
What We Built This Month
May was the first clean month of measurement after April's tracking rebuild. With the foundation set, we shifted focus to the next growth lever: getting Pure Kauai into the answers AI assistants and Google give to luxury Kauai travelers.
AEO foundation shipped
Property-level meta, structured data, and the llms.txt file went live so ChatGPT, Gemini, and Perplexity can confidently cite Pure Kauai properties when travelers ask for recommendations.
38-blog content pipeline launched
First batch of long-form guide content shipped to capture high-intent Kauai planning queries. Built to do work for years, not weeks.
Telecom + CallRail loop closed
Hawaiian Telecom forwarding fixed mid-May. Calls now reach the reservations team and CallRail is logging clean data for the first month in a row.
Revenue snapshot — YTD as of Jun 2, 2026
Identified accommodations revenue
$7.22M
+$353K vs 2025 ($6.87M) · highest ever at this point
% of full year goal ($9.5M)
76.0%
vs 76.3% same point in 2025
Forward-booked revenue
$4.09M
139 future stays on the books
Identified trip count
273
+21 trips vs 2025 (252) · 134 completed / 139 forward
May 2026 — month in review
May accommodations revenue
$788K
+121% vs May 2025 ($356K) · strongest May ever
Completed trip revenue YTD
$3.13M
134 stays completed Jan–May
Revenue per completed trip
$23,344
vs $27,258 in 2025 · mix shift
Revenue per booking total
$26,452
$29,448 forward avg · $23,344 completed avg
Marketing performance highlights — May 2026
Google Ads ROAS
13.9x
$86,710 confirmed on $6,258 spend
Hostfully transactions (check-ins)
$853K
44 stays completed in May
Google Ads clicks
3,267
125,630 impressions · 2.60% CTR
Inbound calls (CallRail)
60
+71% vs May 2025 · telecom fix holding
Revenue pacing — 2026 snapshots
Completed YTD
Forward booked
2026 bookings by source — Hostfully Deep Dash
Strong pace, on par with 2025, more in the pipeline
$7.22M identified through Jun 2 is the highest absolute number ever recorded at this point in the year — $353K ahead of 2025's $6.87M, and $311K ahead of 2023's $6.91M. Pacing as a % of goal (76.0%) is essentially tied with 2025 (76.3%) but on a tougher target ($9.5M vs $9.0M). With $4.09M forward-booked across 139 future stays, the rest of the year is set up to clear the goal cleanly.
May was the standout month
$788K of May accommodations revenue is +121% versus May 2025 ($356K) — the largest YoY month-over-month gain of any 2026 month so far. Mix shift continues: revenue per completed trip ($23,344) is below 2025 ($27,258) because more mid-tier and shoulder-season stays are entering the funnel alongside the flagship estates. Volume + AOV together still net positive.
👉
Heads up — Deep Dash + Flash Report mirrors live here too
For the current Hostfully snapshot you're used to seeing, check out the revenue pacing in the Deep Dash + Flash Report tab. We're keeping our derived pacing view below as well, greyed out until the automated daily pull is live.
Open Deep Dash tab →
2026 snapshots — year to date (Flash Report cut)
| Snapshot | Completed YTD | Forward booked | Identified total | Goal | % of goal | Progress |
|---|---|---|---|---|---|---|
| Feb 4, 2026 | $361,807 | $4,134,902 | $4,496,709 | $9,500,000 | 47.3% | |
| Feb 11, 2026 | $508,923 | $4,307,914 | $4,816,837 | $9,500,000 | 50.7% | |
| Mar 25, 2026 | $1,593,290 | $4,117,484 | $5,710,775 | $9,500,000 | 60.1% | |
| Apr 13, 2026 | $2,071,847 | $4,606,543 | $6,678,390 | $9,500,000 | 70.3% | |
| Jun 2, 2026 latest | $3,128,136 | $4,093,312 | $7,221,449 | $9,500,000 | 76.0% |
Year-over-year — identified YTD (Flash Report cut)
| Year | Identified YTD | Goal | % of goal | Trips | Rev / booking | Progress |
|---|---|---|---|---|---|---|
| 2019 | $5,414,132 | $8,000,000 | 67.7% | 287 | $18,865 | |
| 2023 | $6,911,070 | $9,500,000 | 72.7% | 250 | $27,644 | |
| 2024 | $6,645,457 | $10,000,000 | 66.5% | 267 | $24,889 | |
| 2025 | $6,868,933 | $9,000,000 | 76.3% | 252 | $27,258 | |
| 2026 current | $7,221,449 | $9,500,000 | 76.0% | 273 | $26,452 |
Reading this honestly
2026's identified revenue at this point is $7.22M — the highest absolute number on record by Jun 2, but only $353K ahead of 2025 ($6.87M) and just $311K ahead of 2023 ($6.91M). Pacing as a % of goal (76.0%) is essentially tied with 2025 (76.3%) against a tougher ($9.5M vs $9.0M) goal. Trip count (273) is the second-highest at this point, behind only 2019. Average revenue per booking ($26,452) is below 2025 ($27,258) — mix shift toward more mid-tier and shoulder-season stays, not pricing weakness.
Strong pace, on par with 2025, more in the pipeline
$7.22M identified through Jun 2 is the highest absolute number ever recorded at this point in the year — $353K ahead of 2025 ($6.87M) and $311K ahead of 2023 ($6.91M). Pacing as a % of goal (76.0%) is essentially tied with 2025 (76.3%) but on a tougher target ($9.5M vs $9.0M). $2.28M still to close to hit the $9.5M goal — comfortably within reach given the $4.09M already forward-booked.
How to read forward bookings
Forward bookings represent paid or confirmed upcoming stays. The gap between Identified ($7.22M) and Completed YTD ($3.13M) = $4.09M in confirmed future revenue. As trips complete through the year, Completed will rise toward Identified — and new bookings keep adding to both.
The Story
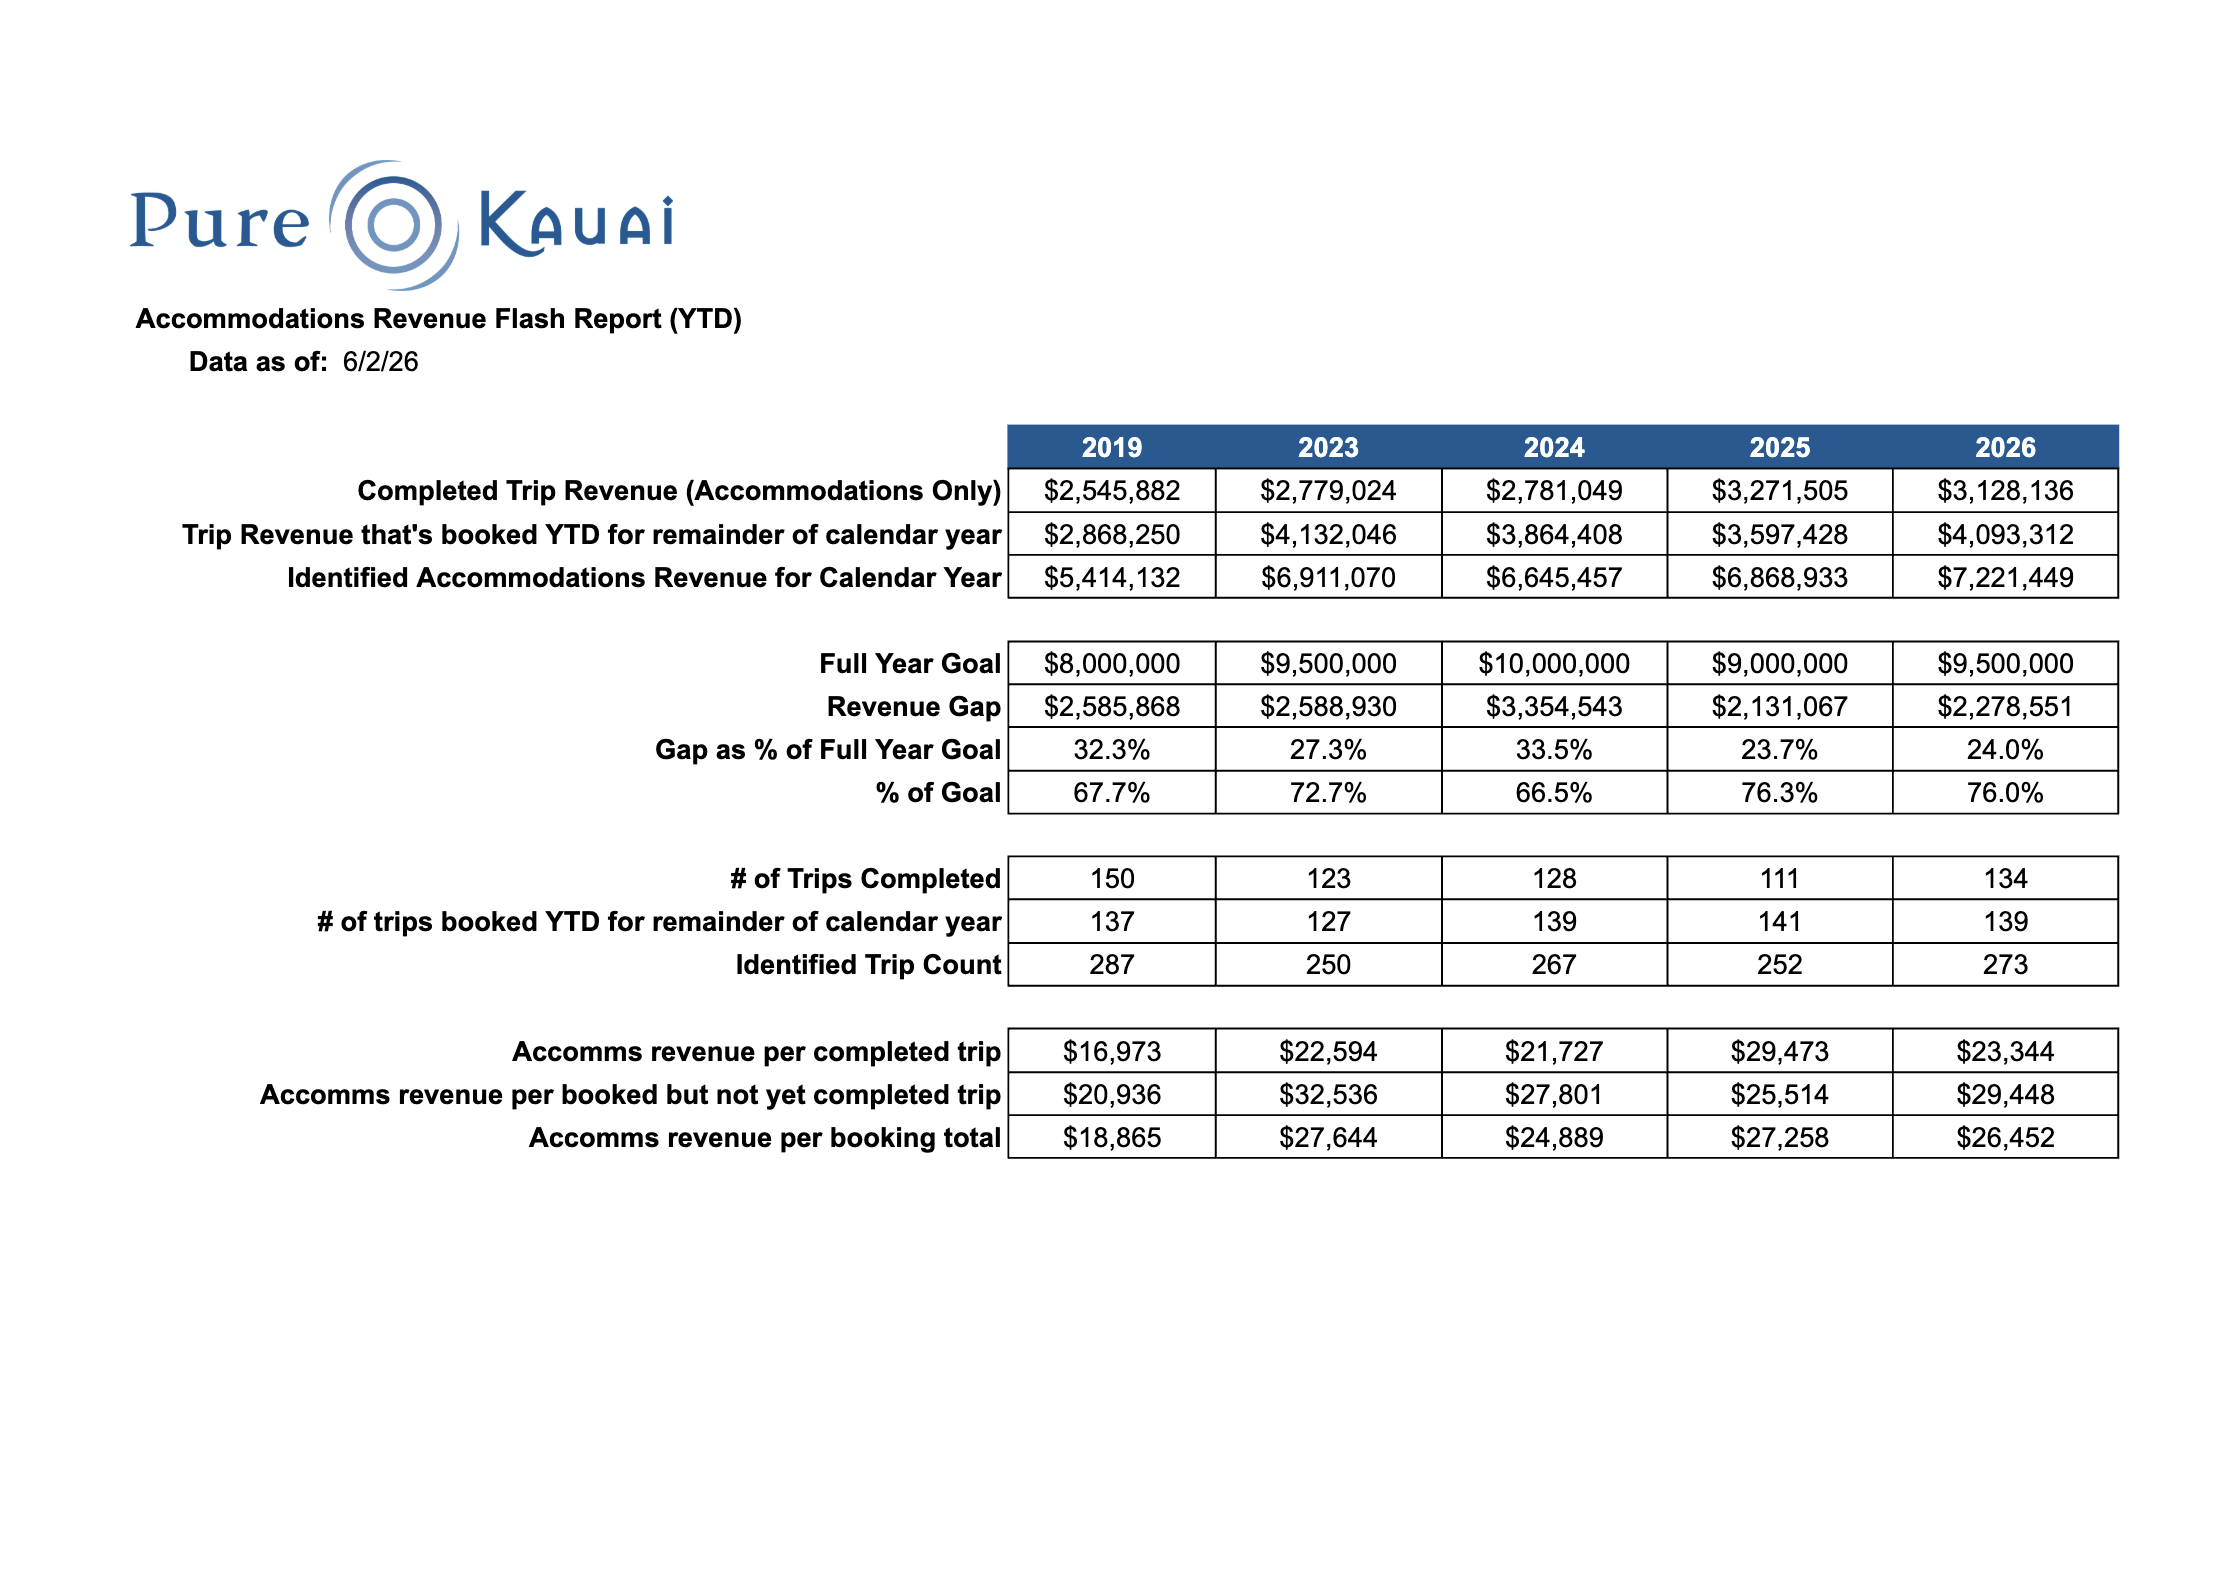
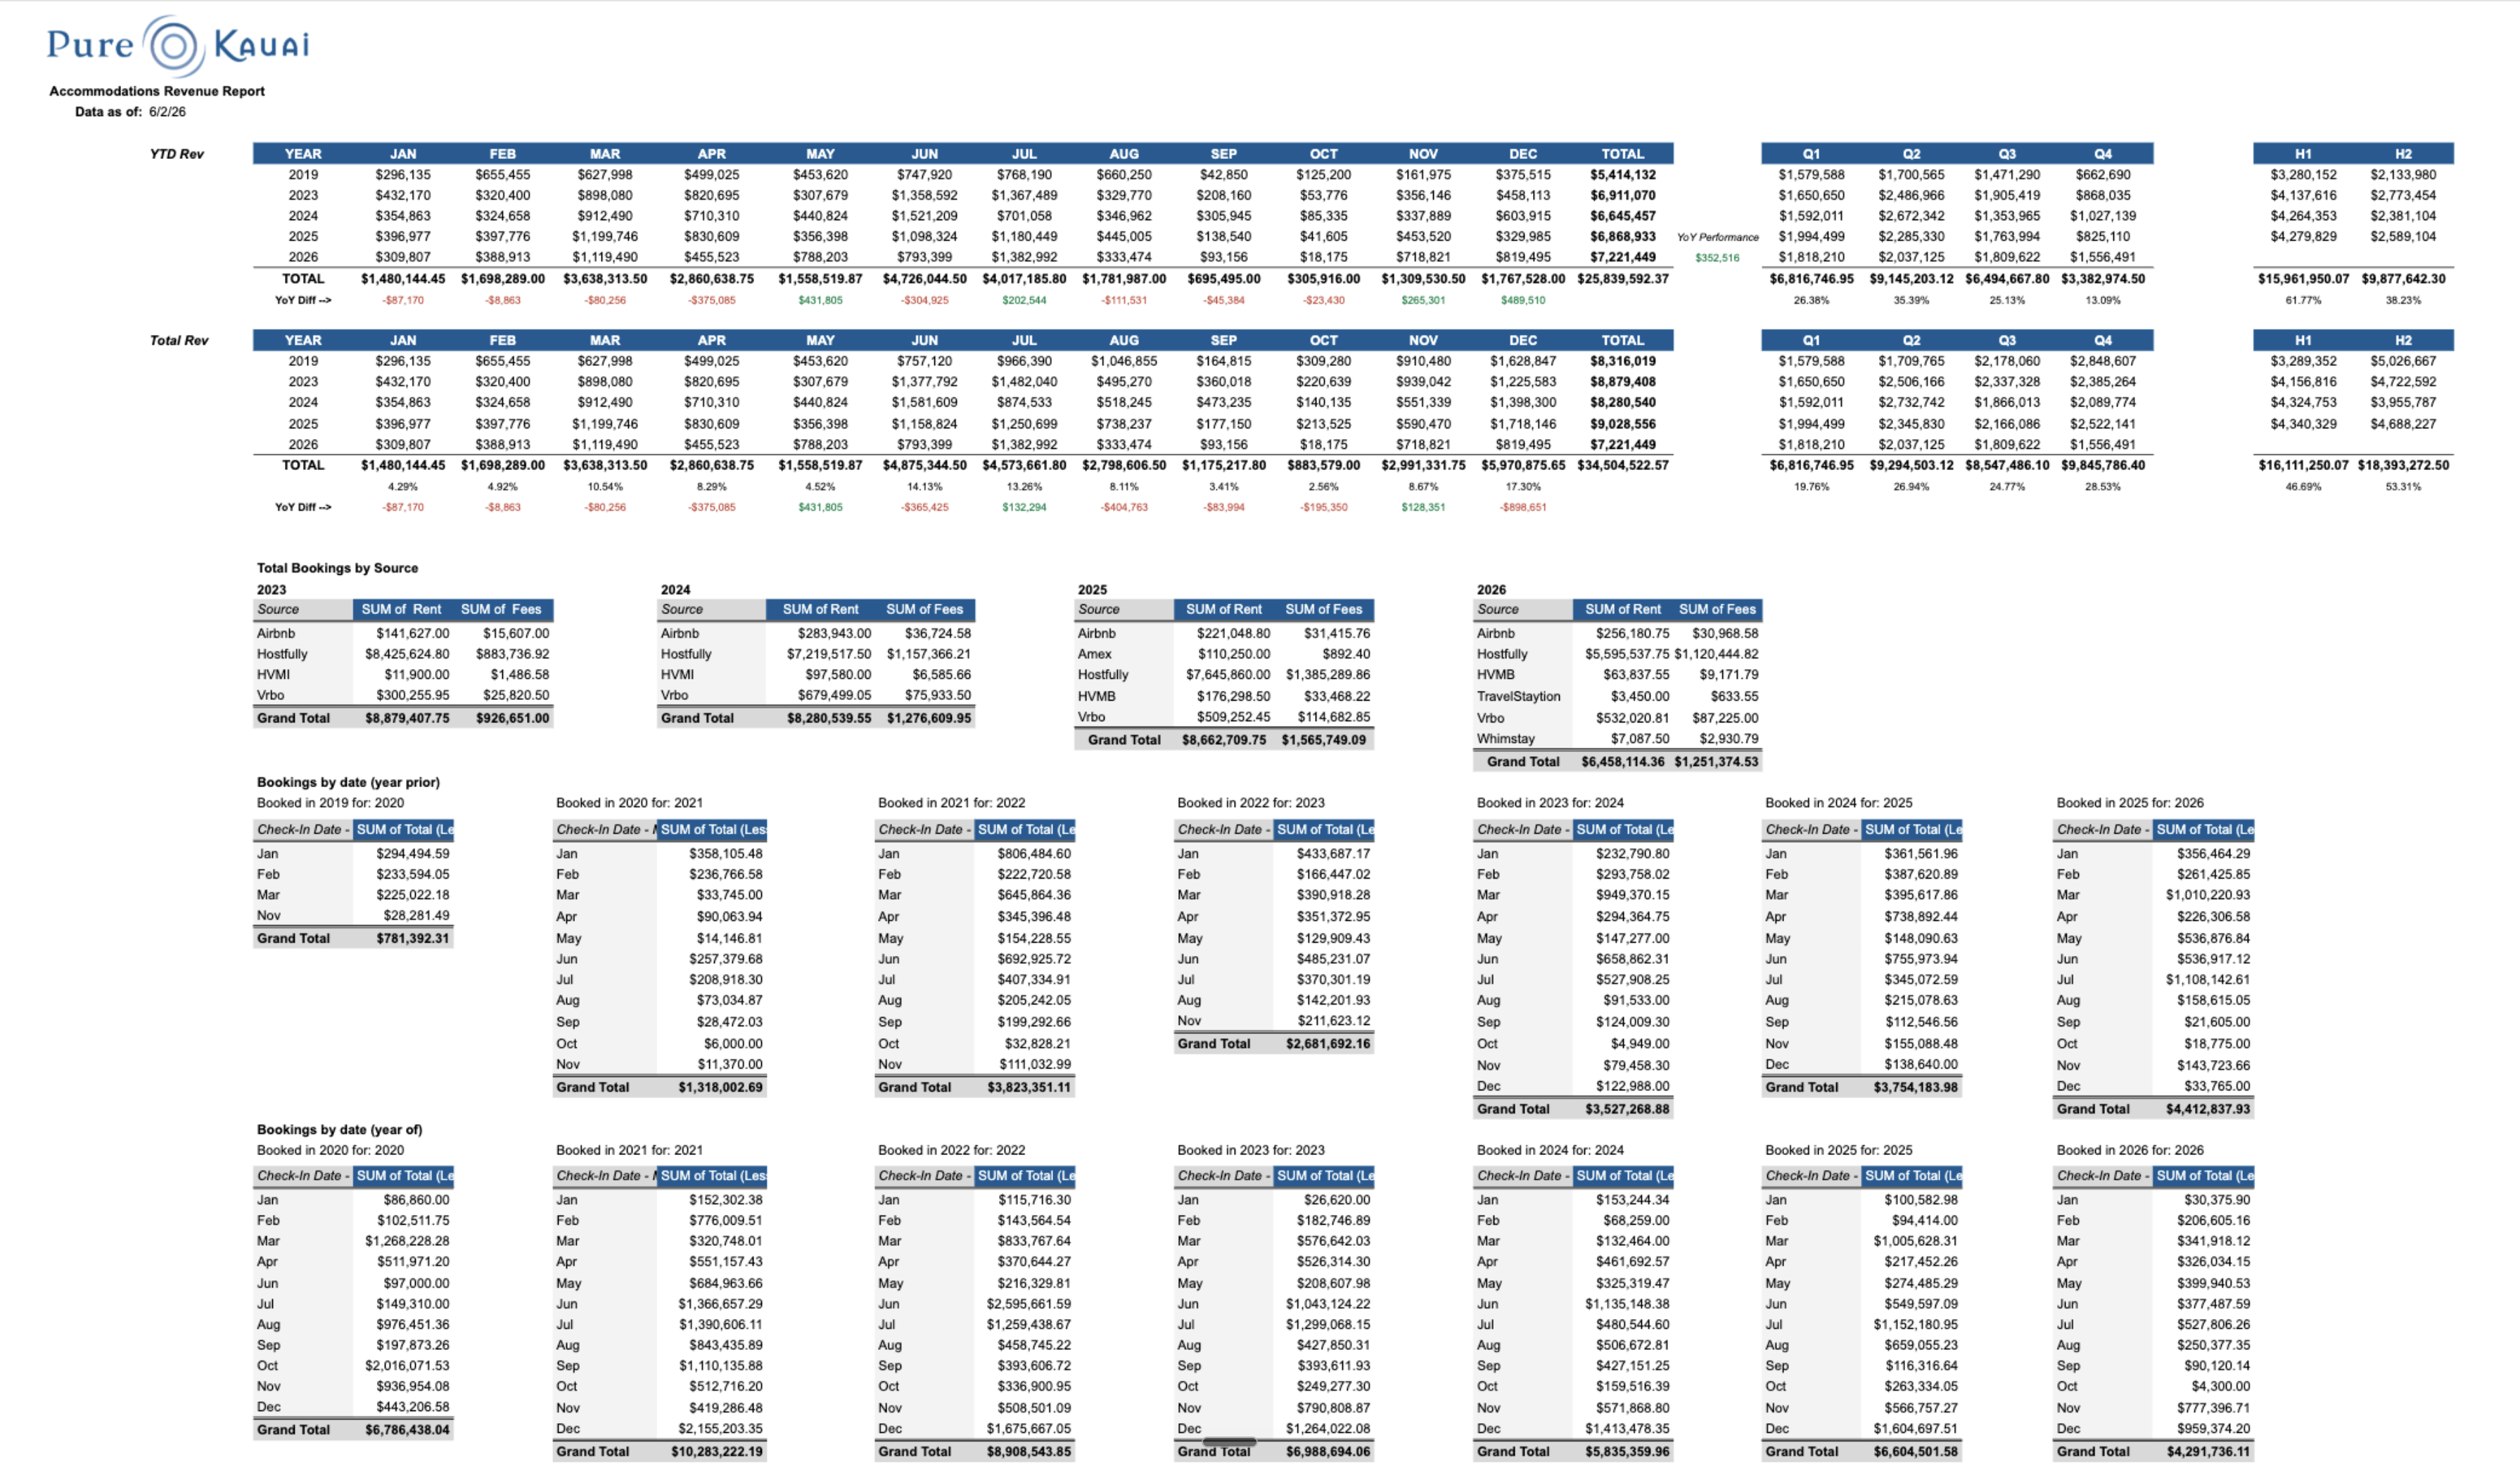
This tab mirrors the two Hostfully exports Pure Kauai has historically used — the Deep Dash Accommodations Revenue Report and the Flash Report (YTD) — both as of Jun 2, 2026. Treat this as the source of truth for revenue pacing until we ship the automated daily pull. Click either screenshot to zoom in.
Flash Report — Accommodations Revenue YTD
Accommodations Revenue Flash Report (YTD)
Data as of 6/2/26 · Identified Calendar-Year Revenue + Goal Gap by year (2019, 2023, 2024, 2025, 2026)
⤢ Click to zoom
Deep Dash — Accommodations Revenue Report (full)
Deep Dash — full accommodations breakdown
YTD & Total revenue by month / quarter / half · Bookings by source · Bookings by date (year prior + year of)
⤢ Click to zoom
Why this view exists
Cody's two PDFs are how Pure Kauai has been seeing pacing for years. Mirroring them in the report keeps continuity with the format the leadership team is used to, while we build the automated daily Hostfully pull that will replace this with a live view.
Why we use this view across the report
Every revenue and pacing number elsewhere in this report (Overview, Revenue Pacing tab, one-pager) is sourced from this Flash Report cut — accommodations rent by check-in month against the calendar-year goal. This keeps the numbers consistent with what Cody and the Pure Kauai leadership team have used for years.
🔗
Open the full Organic dashboard
RightNow Communications hosts the live, interactive Organic + SEO dashboard for Pure Kauai. Click through for the full set of traffic, content, AI Visibility and geo views.
View on RightNow →
The Story
Organic Search is the largest single source of visitors in May: 4,049 sessions (37.8% of all traffic) and $61,270 in attributed revenue. Sessions are down 22% versus May 2025, but the people who do arrive are doing more once they get here — phone calls from Google Organic are up 100% YoY, key events tied to organic traffic held at 67, and the site as a whole shows add-to-cart events up 11,200% YoY. Fewer visitors, qualitatively different behavior. AI Visibility scored a 23/100 — the AEO foundation shipped this month is just beginning to do its work; that score is the baseline we are growing from, not the ceiling.
Headline metrics for May 2026
Organic-attributed revenue
$61,270
66.69 key events from Organic Search
Calls from Google Organic
8
+100% vs May 2025
Organic search sessions
4,049
−22.4% vs May 2025
Time on site (organic)
1:00
96.5% of site average
ROI comparison: Organic vs Paid Search
Organic Search
Revenue earned with zero media spend in May
$61,270
attributed revenue
| Ad spend | $0 |
| Sessions | 4,049 |
| Key events | 66.69 |
| Media ROAS | No media cost |
Google Ads (for comparison)
Same month, paid channel
$86,710
confirmed conv value
| Ad spend | $6,258 |
| Confirmed conversions | 4 |
| Cost per conversion | $1,565 |
| Media ROAS | 13.9x |
Combined channel story
Organic and Paid Search together generated $147,980 in attributed value in May on only $6,258 of ad spend. Organic remains the larger absolute contributor. Paid is the most efficient per dollar. The two grow together as content shipping accelerates and Smart Bidding gets more clean signal.
AI Visibility — baseline for the AEO program
AI Visibility: 23/100 (Low)
Pure Kauai is currently rarely mentioned in LLM outputs compared to competitors. This is the baseline measurement against which the May AEO foundation work (property meta, schema, llms.txt, first batch of the 38-blog pipeline) will be measured. AI Mode is currently the strongest surface (37 mentions, 40.7% share), followed by AI Overview (31 mentions, 34.1%). ChatGPT and Gemini direct mentions are still in the low teens. 96.7% of mentions are US-based — international AEO is wide open.
| AI Surface | Visibility score | Mentions | Share of mentions | Direction |
|---|---|---|---|---|
| Google AI Mode | 21 | 37 | 40.7% | −2 |
| Google AI Overview | 17 | 31 | 34.1% | −6 |
| Gemini | 29 | 12 | 13.2% | +2 |
| ChatGPT | 31 | 11 | 12.1% | −2 |
| Total / aggregate | 23 / 100 | 91 | 100% | −3 |
Top performing content for May 2026
Guide content is doing most of the discovery work. Property pages do the conversion work. Both compounded this month.
Top island-guide articles
| 01 | What is the best month to go to Kauai | 1,234 |
| 02 | Where to see turtles in Kauai | 523 |
| 03 | Where to surf in Kauai | 422 |
| 04 | Things to do in Kauai when it rains | 419 |
| 05 | Best beaches in Kauai for swimming | 411 |
| 06 | Where to stay in Kauai with family | 250 |
Pageviews in May
Top property pages
| 01 | Ikena Lani | 671 |
| 02 | Secret Cove | 504 |
| 03 | Hanalei Hideaway | 501 |
| 04 | Anini Vista Drive Estate | 461 |
| 05 | Secret Beach House | 436 |
| 06 | Hale Ae Kai | 433 |
Pageviews in May
The Story
First clean month after the May 19 telecom fix. 60 inbound calls were logged in May, up 71% versus May 2025 — the highest call volume of the year. Marketing channels (Google Ads + Google Organic + the website itself) drove 22 of those 60 calls. The remaining 38 came from people already on the booking platform or in Direct (returning guests, referrals, repeats) — the signature of a loyalty-driven business doing what it does best. Average call duration is short on most tracking numbers, suggesting many of these are quick check-ins rather than full intake calls; the reservations team should validate that pattern.
Headline call metrics — May 2026
Total inbound calls
60
+71% vs May 2025
Unique callers
26
2.3 avg calls per caller
Calls from marketing channels
22
Google Ads 11 · Organic 8 · Site 3
Calls vs prev period
−9%
65 in Apr → 60 in May (clean baseline)
Call attribution by source
| Source | Calls | YoY change | Read |
|---|---|---|---|
| Direct | 19 | +58% | Returning guests + people who already know the brand |
| platform.hostfully.com | 14 | +100% | People already on the booking platform calling for help |
| Google Ads | 11 | −15% | Paid clicks to a phone call |
| Google Organic | 8 | +100% | SEO doing work — best-month-to-go-to-kauai and similar guides converting to calls |
| www.purekauai.com | 3 | +200% | Direct visits to the site that then called |
| Yahoo Organic | 2 | +100% | — |
| Unknown / Bing Organic / Facebook | 3 | +100% | Tail sources, all small |
Top tracking numbers
| Tracking number | Calls | Unique callers | Avg duration | YoY |
|---|---|---|---|---|
| Website pool — 808-582-8904 | 26 | 11 | 0:34 | +767% |
| Website pool — 808-646-2856 | 7 | 6 | 1:02 | +75% |
| Website pool — 808-646-7397 | 6 | 3 | 0:32 | +50% |
| Website pool — 808-378-7783 | 4 | 4 | 0:18 | −20% |
| Website pool — 808-755-1514 | 4 | 3 | 0:47 | +33% |
| Website pool — 808-470-5220 | 4 | 2 | 0:24 | −33% |
| Website pool — 808-470-4352 | 4 | 2 | 0:34 | flat |
| Website pool — 808-736-3371 | 4 | 3 | 0:17 | +300% |
| Facebook — 808-482-6899 | 1 | 1 | 0:56 | +100% |
Telecom fix is holding
All nine tracking numbers logged calls this month. None show a busy-signal pattern. Compare this to April, where 45 of 58 inbound calls hit a busy signal because Hawaiian Telecom was misrouting forwarding. The May 19 fix is working as designed.
Short call durations on most numbers
Several tracking numbers show 17–34 second average durations. That is below the 1–2 minute range you would expect for a real inquiry. Two possibilities: (1) many of these are repeat callers who already have what they need and are confirming small details, or (2) some calls are dropping before the reservations team engages. The team should listen back to a sample of the 808-582-8904 pool to confirm.
The Story
Brand carried the month. $129 of brand spend earned $58,988 in confirmed conversion value — a 458x ROAS. Account-wide May ROAS landed at 13.9x ($86,710 on $6,258). Slightly below April's 17.2x because volume came from a higher-spend, lower-converting California campaign that didn't post a confirmed conversion this month. Smart Bidding is still in its first 30 days of clean post-Enhanced-Conversions signal.
Headline metrics — May 2026
ROAS
13.9x
$86,710 conv value / $6,258 spend
Spend
$6,258
vs $6,477 in April (−3.4%)
Clicks
3,267
125,630 impressions · 2.60% CTR
Avg CPC
$1.92
Confirmed conversions: 4 · CPA $1,565
Campaigns with spend in May
| Campaign | Channel | Spend | Clicks | Conv | Conv $ | ROAS | Verdict |
|---|---|---|---|---|---|---|---|
| Brand | Search | $129 | 216 | 3.0 | $58,988 | 458x | scale |
| Pure Kauai Main (Geo) | Search | $1,628 | 1,742 | 1.0 | $27,722 | 17.0x | keep |
| Pure Kauai California | Search | $2,371 | 371 | 0 | $0 | — | audit |
| PMax — California Target | PMax | $1,421 | 837 | 0 | $0 | — | monitor |
| Secret Beach | Search | $709 | 101 | 0 | $0 | — | watch |
| PR | Search - Brand - USA | Search | $0 | 0 | 0 | $0 | — | new / no traffic |
Brand is doing the heavy lifting (again)
Brand spent $129 and returned $58,988 in confirmed conversion value at 458x ROAS. This is the same pattern we saw across the 11-month audit. Brand should be funded to whatever its impression share allows — it is, by far, the most efficient dollar in the account.
California is bleeding
$2,371 spent on Pure Kauai California Campaign and $1,421 on PMax California Target — combined $3,792 — produced zero confirmed conversions in May. That is 61% of total May spend with no tracked return. Two angles to investigate: (1) clicks are landing but not converting (landing page or audience mismatch), or (2) conversions are happening through Direct/Organic later and we are missing the assist. Need GA4 + BookingBridge view to settle this.
Conversion actions firing in May
| Action | Category | Events | Conv $ |
|---|---|---|---|
| Purchase (BookingBridge) | Purchase | 4.00 | $86,710 |
| Pure Kauai — GA4 (web) purchase | Purchase | 1.00 | $17,013 |
| Form Capture | Default | 3.00 | — |
| Add to Cart | Add to cart | 4.00 | — |
| Click to call | Phone call lead | 36.00 | — |
| Phone call lead (GA4 event) | Phone call lead | 5.67 | — |
| Phone Call | Contact | 2.00 | — |
| Pure Kauai — GA4 (web) page_view | Page view | 6,421.74 | — |
Cleanup needed: page_view is still counted as a conversion
The "Pure Kauai — GA4 (web) page_view" action fired 6,421 times in May and is still flagged as a conversion event in the account. This was supposed to be removed during April's tracking rebuild. Smart Bidding will still be diluting signal as long as this stays on. Action: remove or demote to secondary in Google Ads → Goals.
Daily spend & clicks — May 2026
The Story
May saw 10,725 sessions and 20,956 pageviews — flat versus April (+3% / +2%) but materially below May 2025 (−56% / −60%). The YoY drop is real and worth understanding: traffic volume is lower, but the people who do arrive are converting more efficiently. Add-to-cart events are up 11,200% YoY, form submits +9.5%, phone calls +71%, purchases +14%. GA4 attributed $552,717 in revenue (vs Hostfully's $853K of stays completed in May) — the $300K gap is offline / agent-assisted booking activity, exactly the pattern of a relationship-driven luxury rental.
Headline web metrics — May 2026
Sessions
10,725
+3% vs Apr · −56% YoY
Pageviews
20,956
+2% vs Apr · −60% YoY
New users
7,855
+8% vs Apr · −62% YoY
GA4-attributed revenue
$552,717
+13% YoY · 24 purchases tracked
Traffic by channel
| Channel | Sessions | Share | YoY | Time on site | vs site avg |
|---|---|---|---|---|---|
| Organic Search | 4,049 | 37.8% | −22.45% | 1:00 | 96.5% |
| Direct | 2,822 | 26.3% | −26.61% | 0:34 | 54.5% |
| Paid Search | 2,528 | 23.6% | −3.51% | 1:28 | 140.7% |
| Cross-network | 731 | 6.8% | +17.71% | 1:28 | 140.7% |
| Referral | 415 | 3.9% | +51.46% | 1:16 | 121.7% |
| Unassigned | 147 | 1.4% | +34.86% | 1:08 | 108.9% |
| Organic Social | 38 | 0.4% | −94.15% | 0:46 | 73.2% |
Key events fired in May (GA4)
Add to cart
113
+11,200% YoY
Form submits
81
+9.5% YoY
Phone calls (GA4 event)
60
+71.4% YoY
Revenue attribution by channel (GA4)
| Channel | Revenue | YoY change | Key events |
|---|---|---|---|
| Unassigned | $269,065 | −$221,657 | 55.82 |
| Direct | $182,377 | −$119,009 | 62.00 |
| Organic Search | $61,270 | −$25,981 | 66.69 |
| Paid Search | $28,509 | −$13,410 | 39.18 |
| Referral | $11,496 | +$1,877 | 52.62 |
| Total (GA4 attributed) | $552,717 | +13% YoY | 276 |
Why GA4 revenue ($552K) and Hostfully revenue ($853K) disagree
GA4 attributes $552K of revenue to web sessions in May. Hostfully shows $853K of stays completed in May. The $300K gap is the offline / agent-assisted side of the business — guests who find Pure Kauai digitally, then call or email a reservation agent, and complete the booking outside the website's tracked funnel. This is the signature of a relationship-driven luxury rental brand. "Unassigned" ($269K) is the largest GA4 bucket precisely because the booking lifecycle frequently leaves the website mid-funnel.
Where the visitors came from in May
| Top US states | Sessions |
|---|---|
| California | 2,879 |
| Hawaii | 1,307 |
| Washington | 515 |
| Texas | 444 |
| New York | 363 |
| Florida | 319 |
| Oregon | 317 |
| Colorado | 269 |
| Top countries | Sessions |
|---|---|
| United States | 9,665 |
| Singapore | 330 |
| Canada | 133 |
| Philippines | 73 |
| United Kingdom | 62 |
| India | 58 |
| Germany | 39 |
| Vietnam | 36 |
Quality went up while volume came down
Add-to-cart events tracked 113 in May vs <1 a year ago. Forms +9%, calls +71%, purchases +14% — all up YoY. The site is doing more booking work per visitor, which is the entire point of the April tracking rebuild and the May AEO foundation. Volume will follow once the content pipeline matures.
The traffic drop is real and needs investigation
10,725 sessions in May 2026 vs ~24,000 in May 2025 is a meaningful drop. Most likely culprits, in priority order: (1) a Google algo / SERP layout shift hitting general "Kauai" queries; (2) a 2025 content piece that previously drove a traffic spike that is no longer indexed; (3) competitor displacement on key terms. Search Console drilldown is the next pull.
Data pending
Issues, risks, and active priorities for June
This section will be filled before the report goes to Wendy. Pulling from these sources next:
This section will be filled before the report goes to Wendy. Pulling from these sources next:
- Status review of CallRail → Google Ads conversion sync
- Confirm telecom forwarding is still clean across all tracking numbers
- AEO progress: how many blog pieces shipped, how many AI citations earned
- Property-page conversion rate post-redesign (where applicable)
- Forward-booking pace into Q4 + holiday windows
What we already have
- Telecom fix — resolved May 19
- AEO foundation — shipped
- 38-blog content pipeline — first batch live