What This Month Tells Us
June puts Pure Kauai in the strongest position it has ever held on the annual goal: 82.2% of the $9.5M target already identified. With the measurement foundation in place, this month's report adds two new lenses — a Social Media view (Instagram + YouTube) and a filled Issues & Actions list — alongside the usual revenue, ads, calls, GA4, and AEO detail.
Record pace on the annual goal
$7.81M identified through Jun 30 is 82.2% of the $9.5M goal — the best position at this point in any tracked year (2025's prior best was 80.6%) and +$553K ahead of 2025 in absolute dollars.
Social Media view added
Starting this month the report tracks Instagram and YouTube on a two-month basis (May + June). The Social Media tab and one-pager card populate once the Meta Business Suite and YouTube Studio exports are in.
AI Visibility climbing
The AEO foundation is compounding: AI Visibility rose to 26/100 from 23 in May, with 695 AI citations earned across 138 cited pages this month.
Revenue snapshot — YTD as of Jun 30, 2026
Identified accommodations revenue
$7.81M
+$553K vs 2025 ($7.25M) · best pace on record
% of full year goal ($9.5M)
82.2%
vs 80.6% same point in 2025
Forward-booked revenue
$3.66M
125 future stays on the books
Identified trip count
299
+36 trips vs 2025 (263) · 174 completed / 125 forward
June 2026 — month in review
June accommodations revenue
$1.08M
−6.5% vs June 2025 ($1.16M) · 2nd-strongest month of 2026
Completed trip revenue YTD
$4.15M
174 stays completed Jan–Jun
Revenue per completed trip
$23,824
vs $28,744 in 2025 · mix shift
Revenue per booking total
$26,109
$29,291 forward avg · $23,824 completed avg
Marketing performance highlights — June 2026
Google Ads ROAS
7.4x
$50,943 confirmed on $6,915 spend
Forward-booked pipeline
$3.66M
125 future stays · incl. July $1.43M
Google Ads clicks
3,859
147,946 impressions · 2.61% CTR
Inbound calls (CallRail)
25
−39% vs June 2025 · organic-driven
2026 accommodations revenue by check-in month
Completed (Jan–Jun)
Forward booked (Jul–Dec)
2026 bookings by source — Hostfully Deep Dash
Best pace on record, more in the pipeline
$7.81M identified through Jun 30 is 82.2% of the $9.5M goal — the strongest pace on record at this point in the year, ahead of 2025's prior-best 80.6% and +$553K ahead in absolute dollars. With $3.66M forward-booked across 125 future stays (including July already at $1.43M), the rest of the year is set up to clear the goal cleanly.
June inside a record year
$1.08M of June accommodations revenue is the second-strongest completed month of 2026, modestly below a strong June 2025 (−6.5%) — not a weakness so much as a tough comp inside a record year. Mix shift continues: revenue per completed trip ($23,824) sits below 2025 ($28,744) as more mid-tier and shoulder-season stays enter the funnel alongside the flagship estates.
The Story
2026 is pacing at the strongest position on record. Identified accommodations revenue climbed from 47.3% of the $9.5M goal in early February to 82.2% by June 30, and the year-end position sits ahead of every tracked year (2025's 80.6% was the prior best). $1.69M remains to close against $3.66M already forward-booked. All figures are the Jun 30 cut of Cody's Accommodations Flash Report and the Pacing by Booking Date tab; the Deep Dash + Flash Report tab carries the source screenshots.
2026 cumulative identified revenue vs $9.5M goal (by check-in month)
2026 snapshots — year to date (Flash Report cut)
| Snapshot | Completed YTD | Forward booked | Identified total | Goal | % of goal | Progress |
|---|---|---|---|---|---|---|
| Feb 4, 2026 | $361,807 | $4,134,902 | $4,496,709 | $9,500,000 | 47.3% | |
| Feb 11, 2026 | $508,923 | $4,307,914 | $4,816,837 | $9,500,000 | 50.7% | |
| Mar 25, 2026 | $1,593,290 | $4,117,484 | $5,710,775 | $9,500,000 | 60.1% | |
| Apr 13, 2026 | $2,071,847 | $4,606,543 | $6,678,390 | $9,500,000 | 70.3% | |
| Jun 2, 2026 | $3,128,136 | $4,093,312 | $7,221,449 | $9,500,000 | 76.0% | |
| Jun 30, 2026 latest | $4,145,308 | $3,661,313 | $7,806,620 | $9,500,000 | 82.2% |
Year-over-year — identified YTD (Flash Report cut)
| Year | Identified YTD | Goal | % of goal | Trips | Rev / booking | Progress |
|---|---|---|---|---|---|---|
| 2019 | $5,719,932 | $8,000,000 | 71.5% | 301 | $19,003 | |
| 2023 | $7,101,611 | $9,500,000 | 74.8% | 261 | $27,209 | |
| 2024 | $7,029,217 | $10,000,000 | 70.3% | 281 | $25,015 | |
| 2025 | $7,253,063 | $9,000,000 | 80.6% | 263 | $27,578 | |
| 2026 current | $7,806,620 | $9,500,000 | 82.2% | 299 | $26,109 |
Reading this honestly
2026's identified revenue by Jun 30 is $7.81M — 82.2% of the $9.5M goal, the strongest pace on record at this point and +$553K ahead of 2025 ($7.25M). Trip count (299) is the highest at this point in any tracked year. Average revenue per booking ($26,109) sits below 2025 ($27,578) — mix shift toward more mid-tier and shoulder-season stays, not pricing weakness.
Best pace on record, more in the pipeline
$7.81M identified through Jun 30 is 82.2% of the $9.5M goal — the strongest pace on record at this point and +$553K ahead of 2025 ($7.25M). $1.69M still to close to hit the $9.5M goal — comfortably within reach given the $3.66M already forward-booked, with July alone on the books at $1.43M.
How to read forward bookings
Forward bookings represent paid or confirmed upcoming stays. The gap between Identified ($7.81M) and Completed YTD ($4.15M) = $3.66M in confirmed future revenue. As trips complete through the year, Completed will rise toward Identified — and new bookings keep adding to both.
The Story
This tab mirrors the two Hostfully exports Pure Kauai has historically used — the Deep Dash Accommodations Revenue Report and the Flash Report (YTD) — both as of Jun 30, 2026. Treat this as the source of truth for revenue pacing until we ship the automated daily Hostfully pull. The tables below reproduce Cody's Flash Report and Deep Dash views exactly, as of Jun 30, 2026.
Flash Report — Accommodations Revenue YTD
Accommodations Revenue Flash Report (YTD)
Data as of 6/30/26 · Identified Calendar-Year Revenue + Goal Gap by year (2019, 2023, 2024, 2025, 2026)
Cody's June 30 sheet
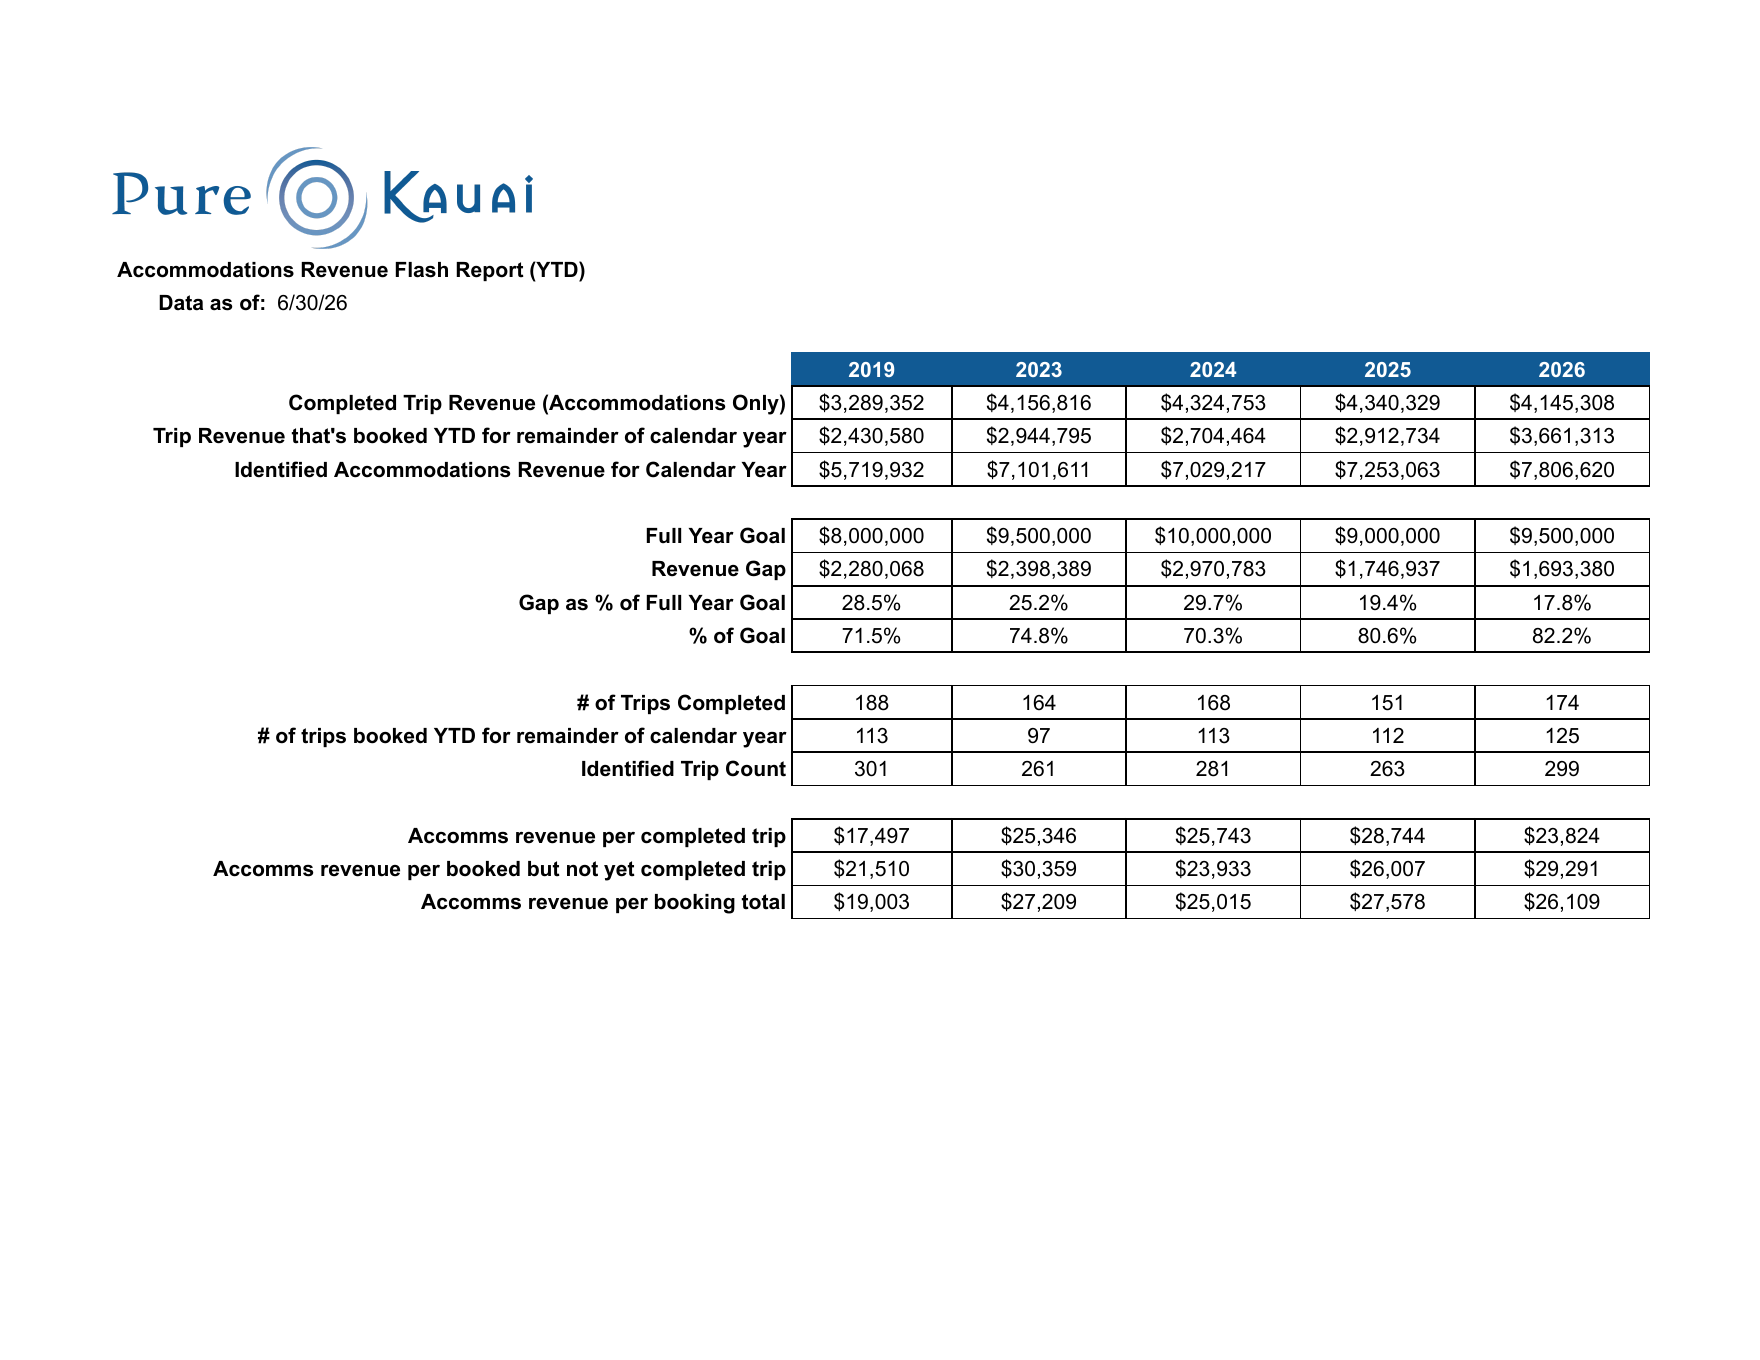
| 2019 | 2023 | 2024 | 2025 | 2026 | |
|---|---|---|---|---|---|
| Completed trip revenue | $3,289,352 | $4,156,816 | $4,324,753 | $4,340,329 | $4,145,308 |
| Booked YTD for rest of year | $2,430,580 | $2,944,795 | $2,704,464 | $2,912,734 | $3,661,313 |
| Identified revenue | $5,719,932 | $7,101,611 | $7,029,217 | $7,253,063 | $7,806,620 |
| Full-year goal | $8,000,000 | $9,500,000 | $10,000,000 | $9,000,000 | $9,500,000 |
| Revenue gap | $2,280,068 | $2,398,389 | $2,970,783 | $1,746,937 | $1,693,380 |
| % of goal | 71.5% | 74.8% | 70.3% | 80.6% | 82.2% |
| Identified trips | 301 | 261 | 281 | 263 | 299 |
| Rev per booking total | $19,003 | $27,209 | $25,015 | $27,578 | $26,109 |
Deep Dash — Accommodations Revenue Report (full)
Deep Dash — full accommodations breakdown
YTD & Total revenue by month / quarter / half · Bookings by source · Bookings by date (year prior + year of)
Cody's June 30 sheet
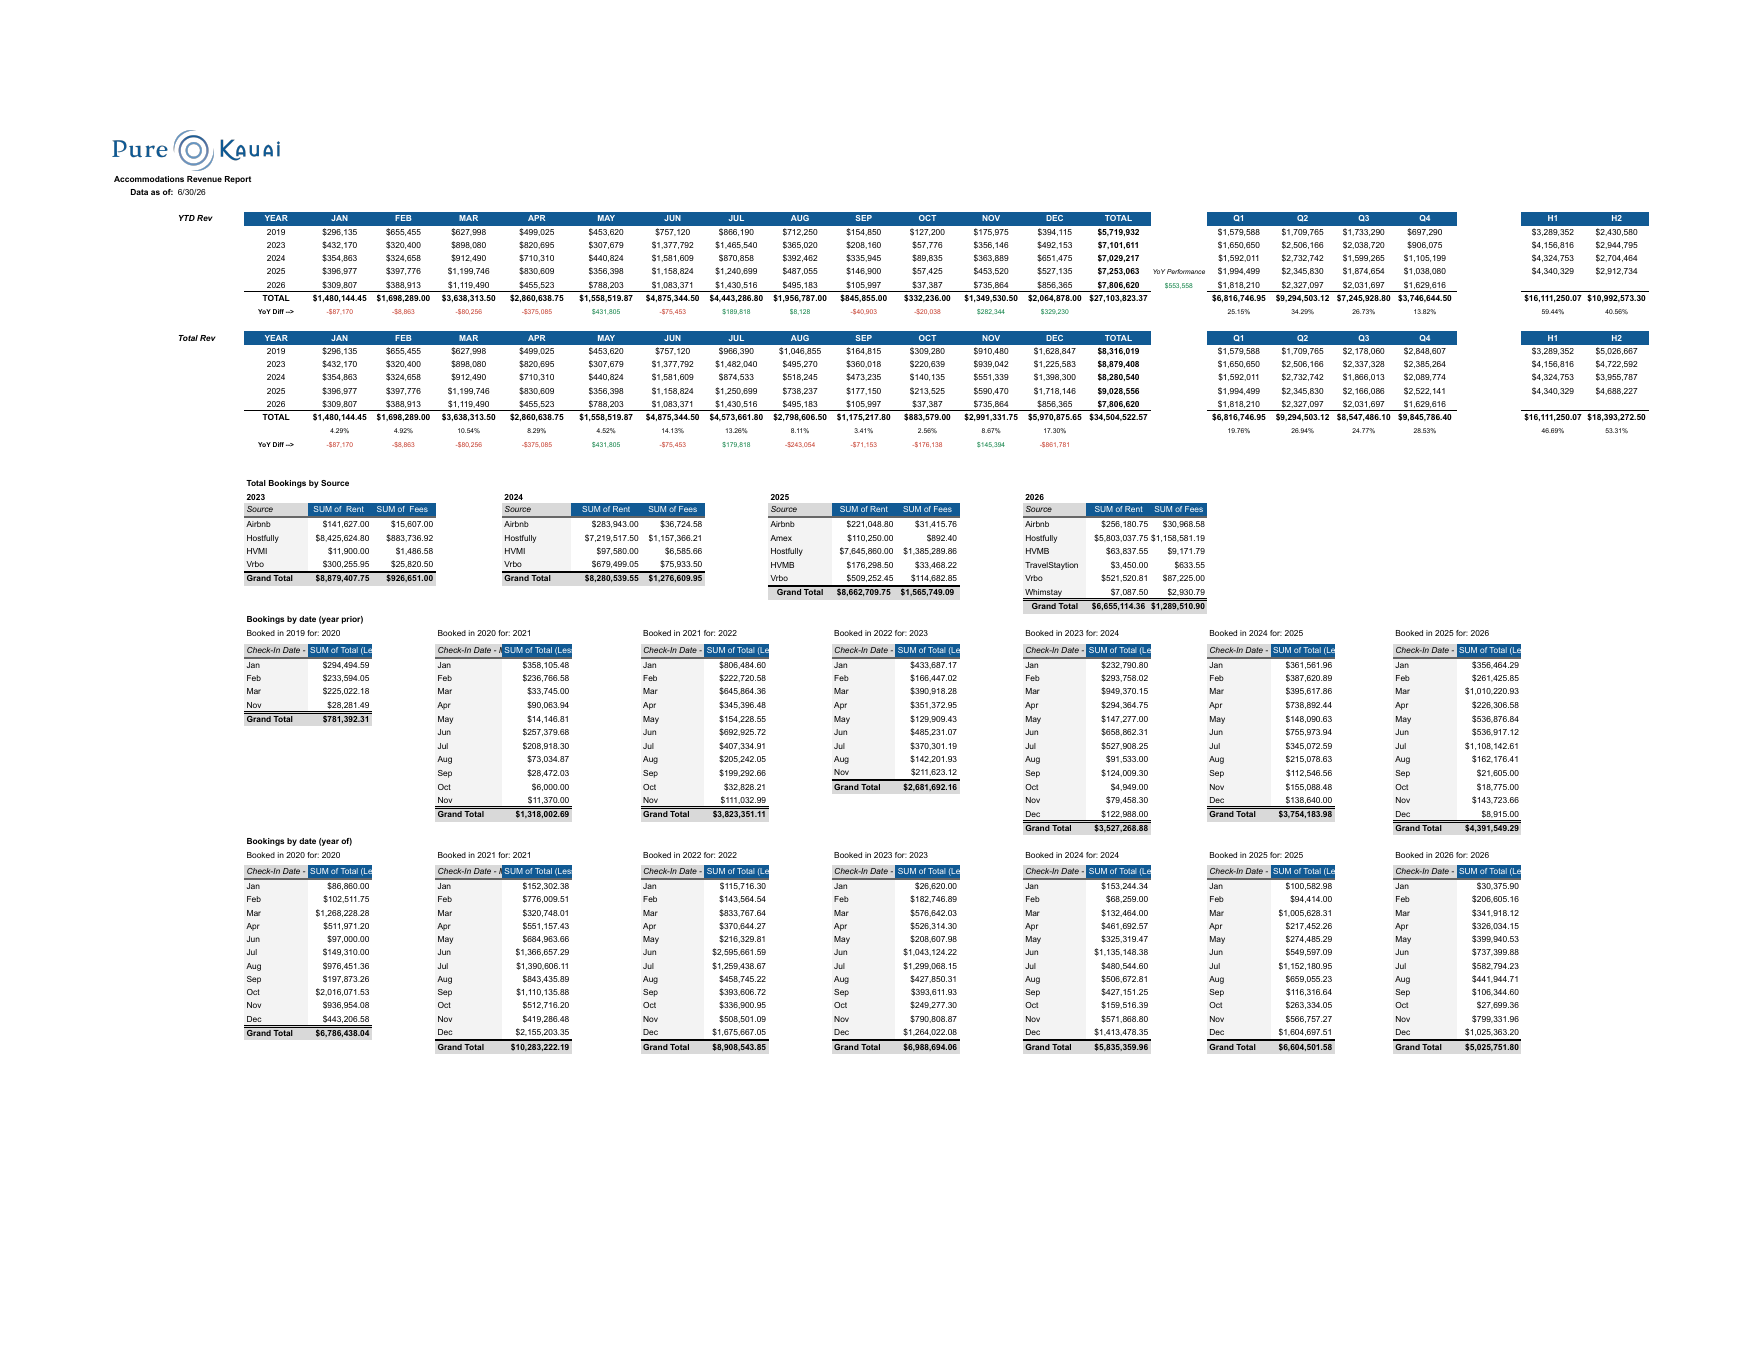
| Check-in month | 2026 | 2025 | YoY |
|---|---|---|---|
| Jan | $309,807 | $396,977 | −22% |
| Feb | $388,913 | $397,776 | −2% |
| Mar | $1,119,490 | $1,199,746 | −7% |
| Apr | $455,523 | $830,609 | −45% |
| May | $788,203 | $356,398 | +121% |
| Jun | $1,083,371 | $1,158,824 | −6.5% |
| Jul (booked) | $1,430,516 | $1,250,699 | +14% |
| Aug (booked) | $495,183 | $738,237 | −33% |
| Sep (booked) | $105,997 | $177,150 | −40% |
| Oct (booked) | $37,387 | $213,525 | −82% |
| Nov (booked) | $735,864 | $590,470 | +25% |
| Dec (booked) | $856,365 | $1,718,146 | −50% |
| Total identified | $7,806,620 | $9,028,556 |
Months Jan–Jun are completed check-ins; Jul–Dec are forward-booked. 2026 booking value by source: Hostfully $6.96M (~88%) · Vrbo $609K · Airbnb $287K · HVMB $73K · Whimstay $10K · TravelStaytion $4K.
Why this view exists
Cody's two PDFs are how Pure Kauai has been seeing pacing for years. Mirroring them in the report keeps continuity with the format the leadership team is used to, while we build the automated daily Hostfully pull that will replace this with a live view.
Why we use this view across the report
Every revenue and pacing number elsewhere in this report (Overview, Revenue Pacing tab, one-pager) is sourced from this Flash Report cut — accommodations rent by check-in month against the calendar-year goal. This keeps the numbers consistent with what Cody and the Pure Kauai leadership team have used for years.
🔗
Open the full Organic dashboard
RightNow Communications hosts the live, interactive Organic + SEO dashboard for Pure Kauai. Click through for the full set of traffic, content, AI Visibility and geo views.
View on RightNow →
The Story
Organic Search is the largest single source of visitors in June: 4,278 sessions (36.6% of all traffic) and $30,034 in attributed revenue. Sessions are down 17% versus June 2025, but the highest-intent organic signal grew — phone calls from Google Organic are up +200% YoY (15 of the month's 25 calls). AI Visibility climbed to 26/100 from May's 23 — still Low, but the AEO foundation is starting to compound, with 695 citations across 138 cited pages.
Headline metrics for June 2026
Organic-attributed revenue
$30,034
49.70 key events from Organic Search
Calls from Google Organic
15
+200% vs June 2025
Organic search sessions
4,278
−17.3% vs June 2025
Time on site (organic)
1:04
Clarity-measured engagement
ROI comparison: Organic vs Paid Search
Organic Search
Revenue earned with zero media spend in May
$30,034
attributed revenue
| Ad spend | $0 |
| Sessions | 4,278 |
| Key events | 49.70 |
| Media ROAS | No media cost |
Google Ads (for comparison)
Same month, paid channel
$50,943
confirmed conv value
| Ad spend | $6,915 |
| Confirmed conversions | 3 |
| Cost per conversion | $2,305 |
| Media ROAS | 7.4x |
Combined channel story
Organic and Paid Search together generated $80,977 in attributed value in June on only $6,915 of ad spend. Paid Search was the larger absolute contributor this month and grew its attributed revenue +$56,606 YoY; Organic is the most efficient per dollar. The two grow together as content shipping accelerates and Smart Bidding gets more clean signal.
AI Visibility — baseline for the AEO program
AI Visibility: 26/100 (Low) — up from 23
The score rose to 26/100 in June from May's 23 — still Low, but moving the right way as the content and structured-data foundation matures. The site earned 695 AI citations across 138 cited pages. AI Mode is the strongest surface (24 mentions, 37.5% share), followed by AI Overview (17, 26.6%). Gemini (14) and ChatGPT (9) are the upside. Total mentions dipped to 64 from 91, even as the composite score rose — citations and cited-page depth are carrying the improvement. 98.4% of mentions are US-based — international AEO is wide open.
| AI Surface | Mentions | Share of mentions | Trend vs May |
|---|---|---|---|
| Google AI Mode | 24 | 37.5% | −13 |
| Google AI Overview | 17 | 26.6% | −14 |
| Gemini | 14 | 21.9% | +2 |
| ChatGPT | 9 | 14.1% | −2 |
| Aggregate — 26 / 100 | 64 | 100% | score +3 |
Top performing content for June 2026
Property pages carried content consumption in June. Island-guide pageviews came in unusually low — almost certainly a tracking artifact from the Framer blog migration in progress, flagged for verification rather than a true content collapse.
Top island-guide articles
| 01 | Do you need to rent a car in Kauai | 18 |
| 02 | What to do in Poipu | 17 |
| 03 | When can you see whales in Kauai | 12 |
| 04 | Villas & homes (guide category) | 9 |
| 05 | Which is better, Kauai or Maui | 5 |
| 06 | Where to hike in Kauai: 7 best trails | 5 |
Pageviews in June
Top property pages
| 01 | Hanalei Oasis | 704 |
| 02 | Hanalei Plantation Villa | 664 |
| 03 | Ikena Lani | 638 |
| 04 | Hanalei Hideaway | 484 |
| 05 | Secret Cove | 480 |
| 06 | Anini Vista Drive Estate | 433 |
Pageviews in June
The Story
June logged 25 inbound calls, down from May's 60 and −39% versus June 2025. The drop is concentrated in Direct and booking-platform calls. The bright spot is Google Organic, up +200% year over year to 15 of the 25 calls — island-guide content converting straight to phone bookings. The open question for the team: is this a normal shoulder-season dip, or has telecom forwarding slipped again after May's fix? Every call that did come through reached the reservations team, so this reads as a volume question rather than a routing failure, but a quick listen-back will confirm.
Headline call metrics — June 2026
Total inbound calls
25
−39% vs June 2025
Unique callers
22
1.1 avg calls per caller
Calls from Google Organic
15
+200% vs June 2025 · 60% of all calls
Calls vs prev period
−58%
60 in May → 25 in Jun
Call attribution by source
| Source | Calls | YoY change | Read |
|---|---|---|---|
| Google Organic | 15 | +200% | SEO doing work — island-guide content converting straight to calls |
| Direct | 5 | −77% | Returning guests + people who already know the brand |
| Google Ads | 3 | −75% | Paid clicks to a phone call |
| www.purekauai.com | 1 | +100% | Direct visits to the site that then called |
| web.ytrei.com | 1 | +100% | Tail referral source |
Top tracking numbers
| Tracking number | Calls | Unique callers | Avg duration | YoY |
|---|---|---|---|---|
| Website pool — 808-582-8904 | 17 | 15 | 1:07 | +143% |
| Website pool — 808-646-7397 | 3 | 3 | 0:40 | −63% |
| Website pool — 808-470-4352 | 2 | 1 | 0:39 | −50% |
| Website pool — 808-755-1514 | 2 | 2 | 4:17 | +191% |
| Website pool — 808-736-3371 | 1 | 1 | 3:14 | −86% |
Organic is carrying the phone line
Google Organic drove 15 of June's 25 calls, up +200% year over year — the island-guide content turning searches into phone bookings. Even with total volume down, the highest-intent channel grew. Every call that came in reached the reservations team cleanly.
Volume drop is the watch item
June's 25 calls is a steep step down from May's 60 and −39% versus June 2025, concentrated in Direct and booking-platform calls. Two possibilities: a normal shoulder-season dip, or telecom forwarding slipping again after the May repair. A quick check of the forwarding chain plus a listen-back to a sample of the 808-582-8904 pool will settle which it is before next month.
The Story
Geo carried the month. The Pure Kauai Main (Geo) campaign returned $41,109 in confirmed conversion value on $2,184 of spend — an 18.8x ROAS and 2 of the account's 3 conversions. Brand stayed the most efficient dollar at 76x ($9,834 on $129) but posted only one conversion. Account-wide June ROAS landed at 7.4x ($50,943 on $6,915), below May's 13.9x because the California campaigns and Secret Beach spent $4,602 with zero tracked conversions.
Headline metrics — June 2026
ROAS
7.4x
$50,943 conv value / $6,915 spend
Spend
$6,915
vs $6,258 in May (+10.5%)
Clicks
3,859
147,946 impressions · 2.61% CTR
Avg CPC
$1.79
Confirmed conversions: 3 · CPA $2,305
Campaigns with spend in June
| Campaign | Channel | Spend | Clicks | Conv | Conv $ | ROAS | Verdict |
|---|---|---|---|---|---|---|---|
| Pure Kauai Main (Geo) | Search | $2,184 | 2,352 | 2.0 | $41,109 | 18.8x | keep |
| Brand | Search | $129 | 230 | 1.0 | $9,834 | 76x | scale |
| Pure Kauai California | Search | $2,181 | 421 | 0 | $0 | — | audit |
| PMax — California Target | PMax | $1,474 | 732 | 0 | $0 | — | audit |
| Secret Beach | Search | $947 | 124 | 0 | $0 | — | watch |
Geo is doing the heavy lifting
The Geo campaign spent $2,184 and returned $41,109 in confirmed conversion value at 18.8x ROAS — 2 of the account's 3 conversions. Brand remains the single most efficient dollar (76x on $129) but is capped at 94.5% impression share. Fund Geo and Brand first; they are doing all the measurable work.
California is bleeding
Pure Kauai California ($2,181), PMax California Target ($1,474) and Secret Beach ($947) — combined $4,602 — produced zero confirmed conversions in June. That is 67% of total June spend with no tracked return, and the same pattern as May, now more pronounced. PMax California's 0.64% CTR is the weakest signal in the account. Two angles: clicks landing but not converting, or conversions completing later via Direct/Organic. The GA4 + BookingBridge cross-check is the next step before reallocating.
Conversion actions firing in June
| Action | Category | Events | Conv $ |
|---|---|---|---|
| Purchase (BookingBridge) | Purchase | 3.00 | $50,943 |
| GA4 purchase (web) | Purchase | 21.00 | $279,003 |
| Form Capture | Default | 82.00 | — |
| Add to Cart | Add to cart | 69.00 | — |
| Phone call (GA4 event) | Phone call lead | 25.00 | — |
Conversion volume is thin — protect the signal
June logged just 3 confirmed conversions account-wide, all from Geo and Brand, because Google Ads counts only confirmed BookingBridge purchases. That makes the California campaigns' zero-conversion months hard to read — the clicks may genuinely not convert, or the bookings may complete later via Direct/Organic and go un-credited. The GA4 + BookingBridge cross-check now in progress will settle it. Until then, hold California to a test budget and keep funding Geo and Brand.
Spend vs confirmed conversion value by campaign — June 2026
The Story
June saw 11,674 sessions and 22,564 pageviews — up about 12% versus May, but below June 2025 (−46% / −47%). The YoY drop is real, but conversion behavior held: purchases 21 (+50% YoY), form submits 82 (+52% YoY), add-to-cart 69. GA4 attributed $279,003 in revenue (vs Hostfully's $1.08M of June check-ins) — the gap is offline / agent-assisted booking activity, the signature of a relationship-driven luxury rental. The standout: Paid Search attributed revenue jumped +$56,606 YoY to $85,116, now the #2 channel.
Headline web metrics — June 2026
Sessions
11,674
+12% vs May · −46% YoY
Pageviews
22,564
+12% vs May · −47% YoY
New users
8,616
+13% vs May · −49% YoY
GA4-attributed revenue
$279,003
−34% YoY · 21 purchases tracked
Traffic by channel
| Channel | Sessions | Share | YoY vs 2025 |
|---|---|---|---|
| Organic Search | 4,278 | 36.6% | −17.32% |
| Direct | 3,417 | 29.3% | +1.82% |
| Paid Search | 2,900 | 24.8% | +57.44% |
| Referral | 856 | 7.3% | +309.57% |
| Unassigned | 303 | 2.6% | +248.28% |
| Cross-network | 202 | 1.7% | −92.41% |
| AI Assistant | 45 | 0.4% | +100% |
| Organic Video | 39 | 0.3% | +1,200% |
Key events fired in June (GA4)
Add to cart
69
+9.5% YoY
Form submits
82
+51.85% YoY
Phone calls (GA4 event)
25
−37.5% YoY
Revenue attribution by channel (GA4)
| Channel | Revenue | YoY change | Key events |
|---|---|---|---|
| Unassigned | $95,150 | −$173,915 | 38.77 |
| Paid Search | $85,116 | +$56,606 | 25.65 |
| Direct | $68,702 | −$113,674 | 30.00 |
| Organic Search | $30,034 | −$31,236 | 49.70 |
| Referral | $1 | −$11,495 | 48.38 |
| Total (GA4 attributed) | $279,003 | −34% YoY | 192.5 |
Why GA4 revenue ($552K) and Hostfully revenue ($853K) disagree
GA4 attributes $279K of revenue to web sessions in June. Hostfully shows $1.08M of accommodations revenue for June check-ins. The gap is the offline / agent-assisted side of the business — guests who find Pure Kauai digitally, then call or email a reservation agent and complete the booking outside the website's tracked funnel. This is the signature of a relationship-driven luxury rental brand. "Unassigned" ($95K) and Direct ($69K) remain the largest GA4 buckets precisely because the booking lifecycle frequently leaves the website mid-funnel.
Where the visitors came from in June
| Top US states | Sessions |
|---|---|
| California | 3,121 |
| Hawaii | 1,296 |
| Washington | 574 |
| Texas | 524 |
| Oregon | 428 |
| New York | 354 |
| Colorado | 319 |
| Florida | 272 |
| Top countries | Sessions |
|---|---|
| United States | 10,476 |
| Singapore | 351 |
| United Kingdom | 116 |
| Canada | 109 |
| India | 96 |
| Spain | 42 |
| France | 41 |
| Germany | 37 |
Quality went up while volume came down
Purchases 21 (+50% YoY), form submits 82 (+52% YoY) and add-to-cart 69 held up while sessions fell. Paid Search attributed revenue jumped +$56,606 YoY to $85,116, now the #2 channel. The site keeps doing more booking work per visitor — the entire point of the tracking rebuild and the AEO foundation.
The traffic drop is real and needs investigation
11,674 sessions in June 2026 vs ~21,600 in June 2025 (−46%) is a meaningful drop. Most likely culprits, in priority order: (1) a Google algo / SERP layout shift on general "Kauai" queries; (2) the Framer blog migration in progress temporarily affecting indexed guide content — note island-guide pageviews came in unusually low this month; (3) competitor displacement. Search Console drilldown, plus a check that migrated blog URLs still resolve and track, is the next pull.
The Story
This is a 90-day reflection (Apr 2 – Jun 30, 2026). Instagram is the engagement engine (11.7K views, +192%), Facebook mirrors the same creative for free incremental reach (2.9K views, +239%), and YouTube reaches a different, older, male, TV-watching US audience that is growing fast. Each channel is broken out below with its Meta Business Suite / YouTube Studio screenshot.
Channel comparison — last 90 days
| Channel | Posts | Views | Reach / Viewers | Interactions |
|---|---|---|---|---|
| 11 | 11,693 | 3,200 | 670 | |
| 14 | 2,903 | 1,428 | 74 |
InstagramLast 90 days · 11 posts · 3.2K reached · 670 interactions
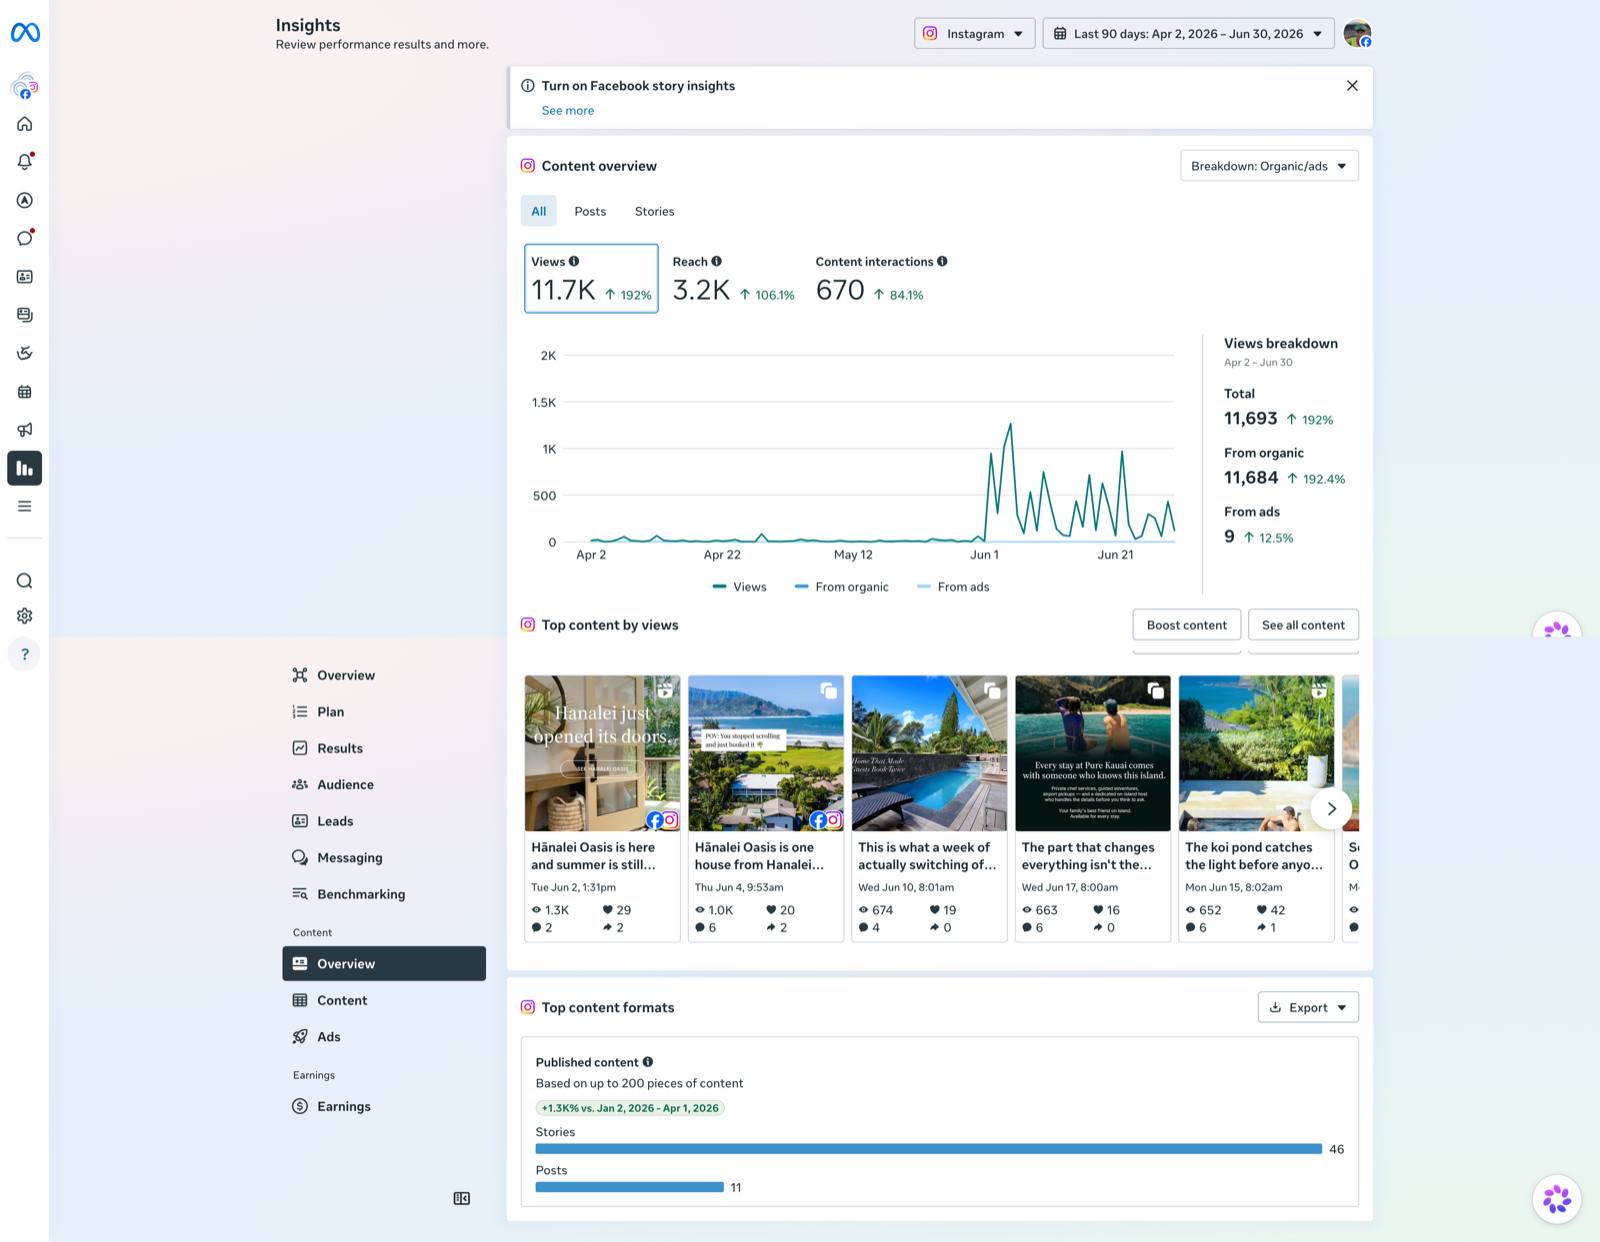
Instagram overview (Meta Business Suite) — drop social-instagram.png into assets/ to display it here
Top Instagram posts (by views)
| Post | Views | Reach | Engagements |
|---|---|---|---|
| Hānalei Oasis launch (reel) | 1,182 | 638 | 32 |
| Hānalei Oasis (carousel) | 979 | 390 | 28 |
| Kamalani Modern (carousel) | 674 | 321 | 26 |
| 25 years of concierge (carousel) | 662 | 328 | 23 |
| Ikena Lani (reel) | 652 | 479 | 51 |
| Secret Beach House (reel) | 627 | 457 | 30 |
FacebookLast 90 days · 14 posts · 1,428 viewers · 74 interactions
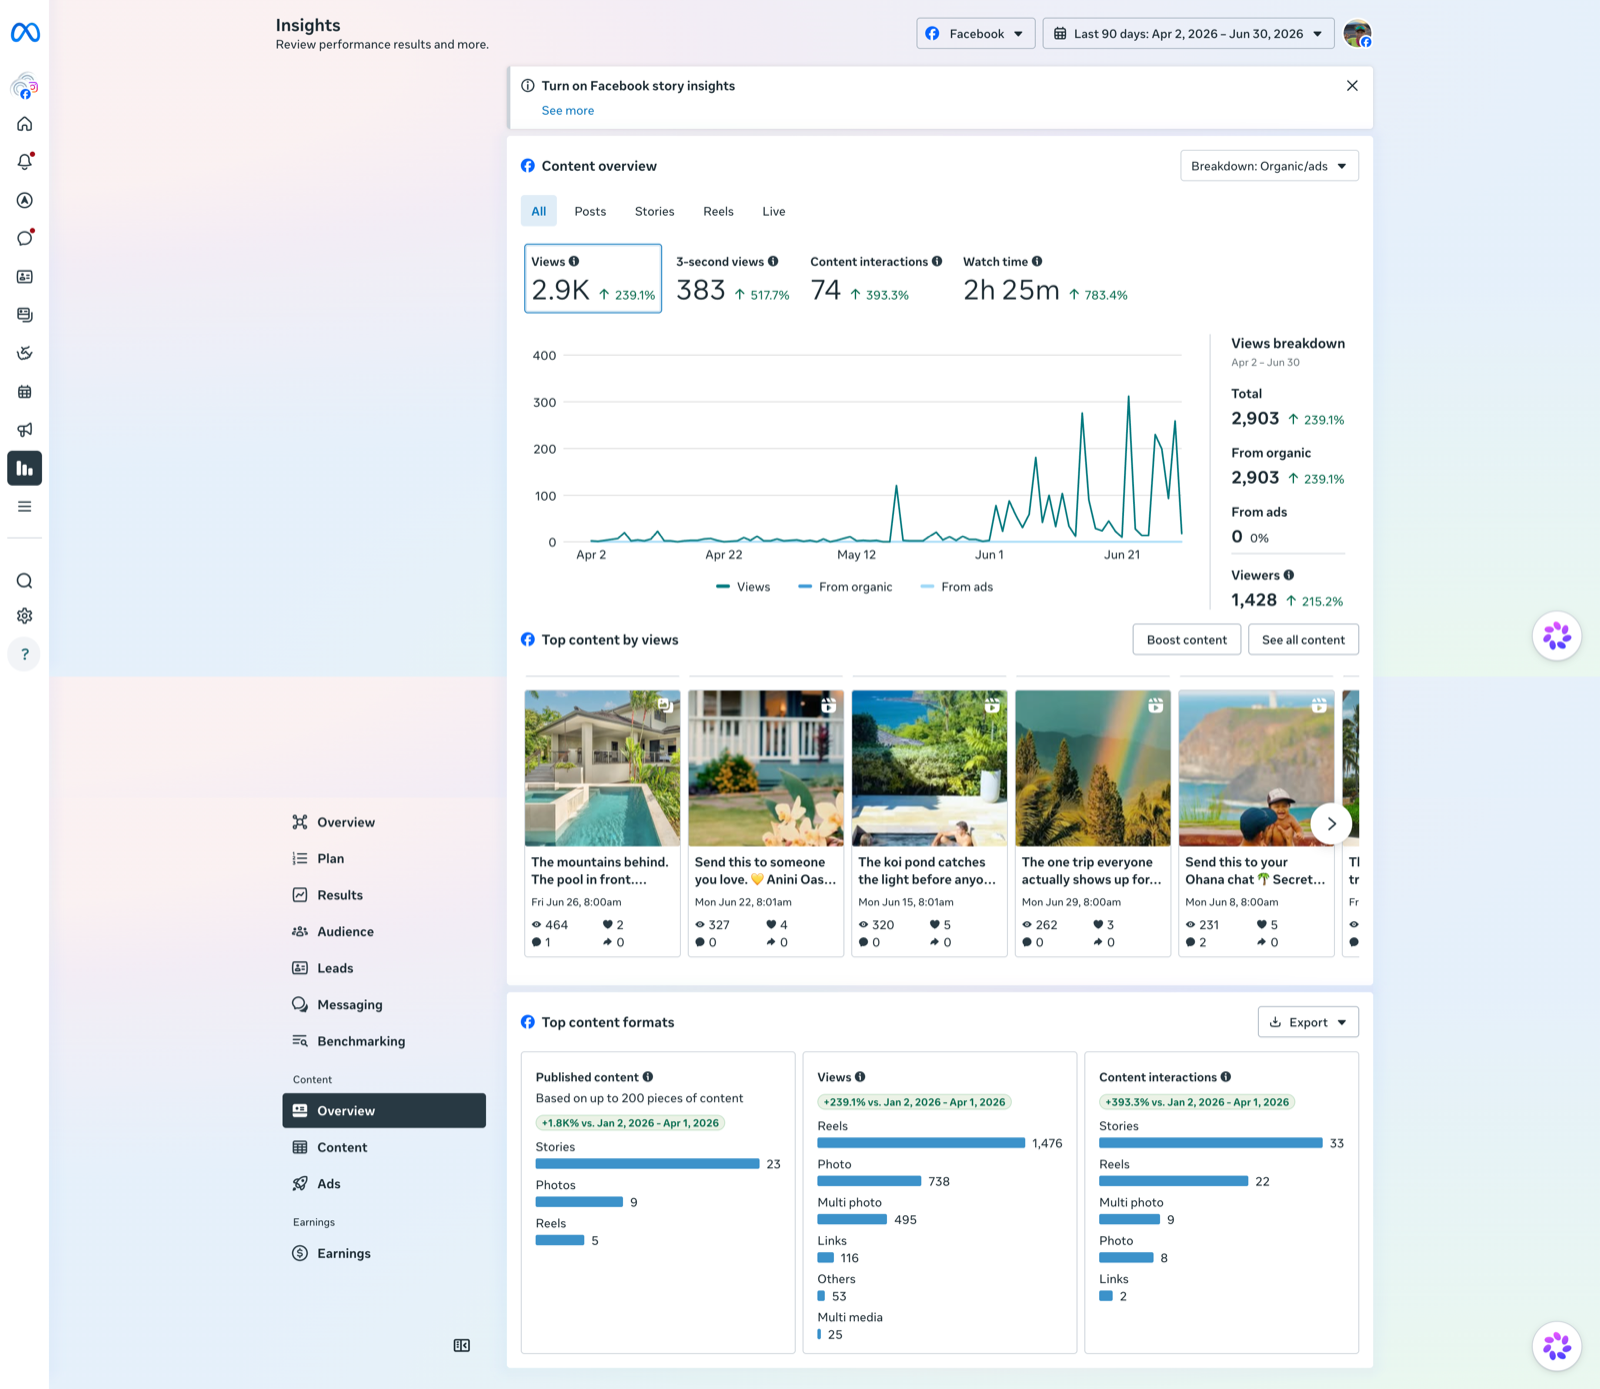
Facebook overview (Meta Business Suite) — drop social-facebook.png into assets/ to display it here
Top Facebook posts (by reach)
| Post | Reach | Views | Engagements |
|---|---|---|---|
| Hanalei Plantation Villa (photo) | 340 | 463 | 3 |
| Ikena Lani (video) | 280 | 320 | 5 |
| Anini Oasis (video) | 279 | 326 | 4 |
| The Red House (video) | 222 | 250 | 2 |
| Secret Beach House (video) | 177 | 231 | 7 |
YouTubeLast 90 days · Apr 2 – Jun 30, 2026
Views
5,148
+226% vs prior 90 days
Watch time
66.0 hrs
+116% vs prior 90 days
Subscribers
+16
98 total · +433% vs prior 90 days
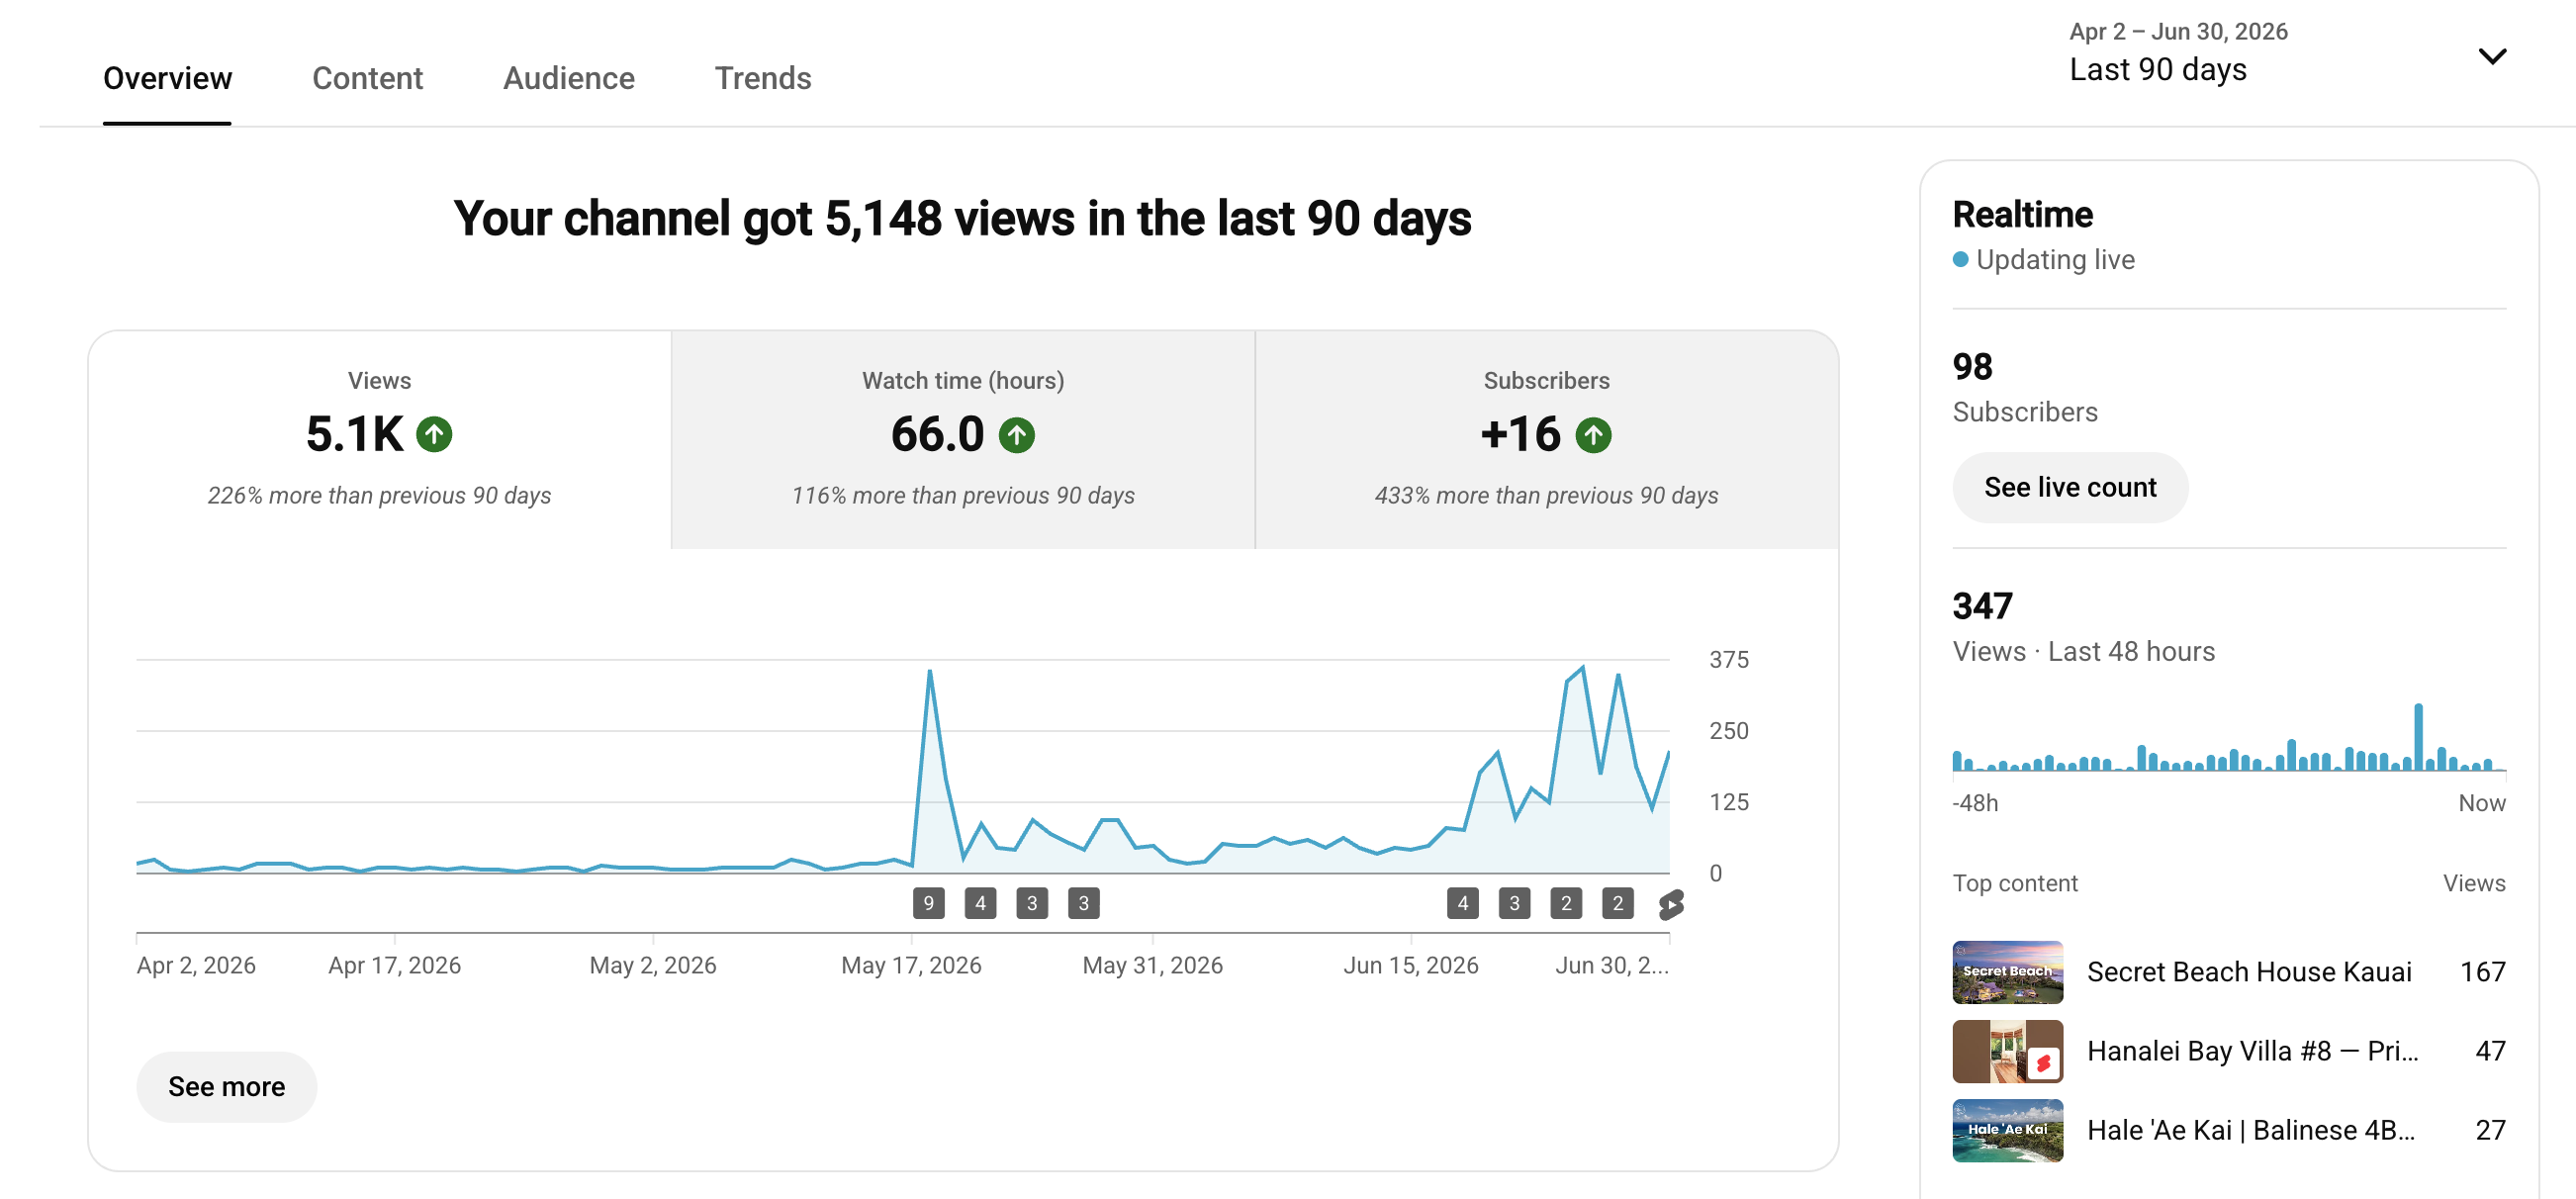
YouTube Studio overview — drop social-youtube.png into assets/ to display it here
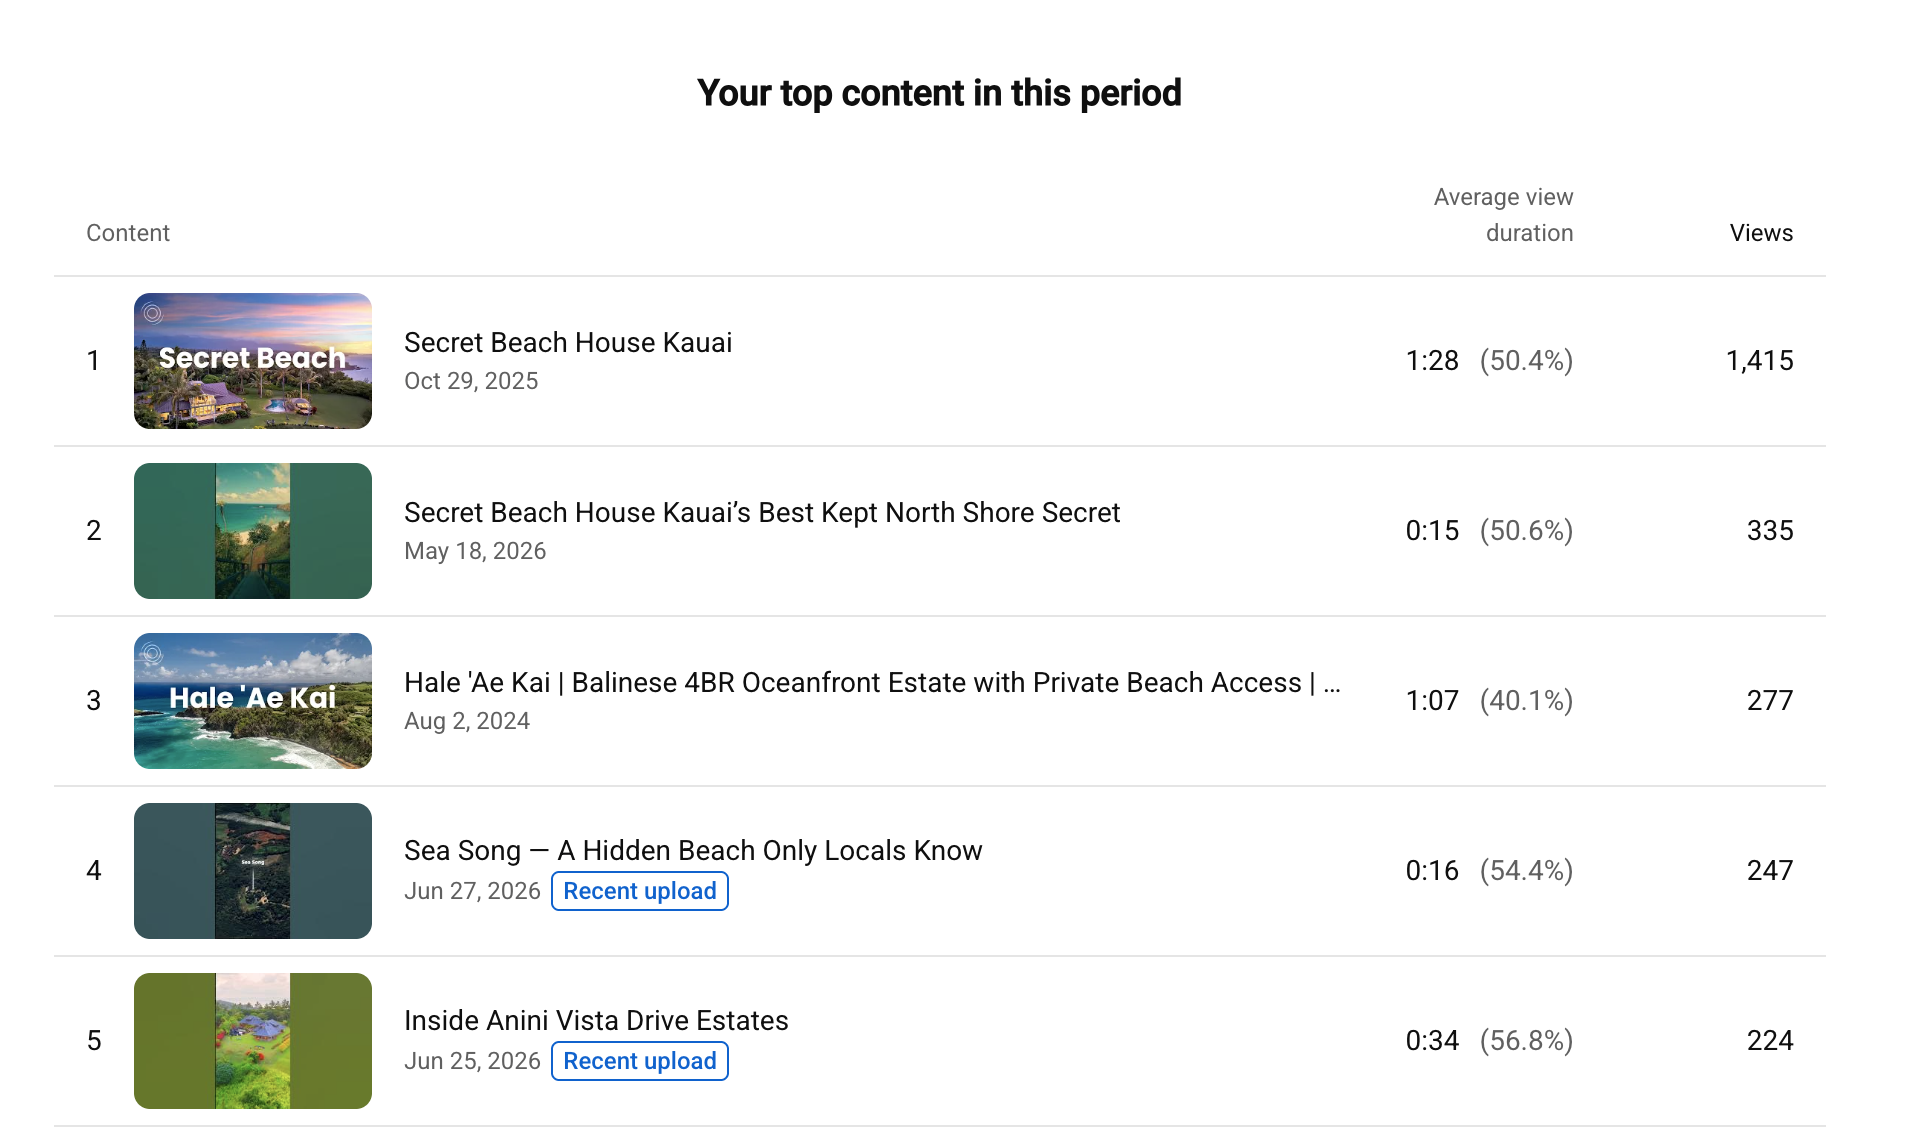
YouTube top content (top videos) — drop social-youtube-top.png into assets/ to display it here
Secret Beach House is running on ads
The top video, Secret Beach House Kauai (1,415 views, well ahead of everything else), has paid promotion running against it, so its views are partly ad-boosted rather than purely organic. The channel's strong quarter (+226% views) is partly on the back of that spend — worth keeping in mind when reading the growth.
Who YouTube reaches
A very different audience than Instagram: 95.7% male, almost all 45+, watching mostly on a TV (55% of watch time), half in the United States. Older, big-screen, and in pure discovery mode (80% new viewers).
Needs attention now
- California ad spend is leaking. Pure Kauai California, PMax California Target and Secret Beach spent $4,602 (67% of June Google Ads spend) for zero confirmed conversions. Run the California audit before next month's budget; PMax California's 0.64% CTR is the first thing to pull apart.
- Phone volume dropped to 25 (from 60 in May), −39% YoY. Confirm whether this is a shoulder-season dip or telecom forwarding slipping again after the May fix — listen back to a sample of the 808-582-8904 pool and re-check the forwarding chain.
- Verify blog tracking after the Framer migration. Island-guide pageviews came in at single/double digits this month versus 1,000+ in May. Almost certainly a tracking artifact from the migration in progress — confirm migrated URLs resolve and fire GA4, not a true content collapse.
Watch this month
- Add Contact / chat to the booking page. Clarity logged 225 sessions on booking pages with 72 dead clicks; the founder counted four clicks to reach Contact Us from the booking flow. A one-click contact or chatbot on the booking page is the highest-leverage UX fix.
- Finish the GA4 + BookingBridge cross-check. The join that settles whether California clicks convert later via Direct/Organic is the difference between cutting and keeping those campaigns.
- Populate the Social Media tab. Drop in the Instagram + YouTube view (May + June) once the Meta Business Suite and YouTube Studio exports are in.
Going well
- Record pace on the annual goal — $7.81M identified, 82.2% of the $9.5M target, +$553K ahead of 2025.
- Geo returned 18.8x ($41,109 on $2,184) and Brand 76x; together all $50,943 of confirmed value.
- AI Visibility up to 26/100 from 23, with 695 citations across 138 cited pages.
- Google Organic calls up +200% YoY (15 of 25), and Paid Search attributed revenue up +$56K YoY to the #2 channel.