What This Month Tells Us
July was the biggest month of the year and pushed Pure Kauai to the most revenue ever identified at this point on the calendar: $8.10M, 85.3% of the $9.5M goal. The month also reversed June's two soft spots — organic traffic and phone calls both recovered strongly — while the Deep Dash, ads, calls, GA4 and AEO detail all refresh below.
Most identified revenue on record
$8.10M identified through Jul 31 is 85.3% of the $9.5M goal — level with 2025's record pace and +$419K ahead of 2025 in absolute dollars, the most ever identified at this point in the year.
July was the biggest month
$1.47M of accommodations revenue for July check-ins, +17.8% vs July 2025 — the strongest completed month of 2026, landing well above last year rather than merely matching it.
Organic recovered
Organic search sessions rose +35% YoY and SEO pageviews +54% YoY as the island-guide content tracked again after the Framer migration — reversing June's dip and lifting organic revenue to $61,704.
Revenue snapshot — YTD as of Jul 31, 2026
Identified accommodations revenue
$8.10M
+$419K vs 2025 ($7.68M) · most on record at this point
% of full year goal ($9.5M)
85.3%
level with 2025's record 85.3%
Forward-booked revenue
$2.49M
93 future stays on the books
Identified trip count
309
+31 trips vs 2025 (278) · 216 completed / 93 forward
July 2026 — month in review
July accommodations revenue
$1.47M
+17.8% vs July 2025 ($1.25M) · strongest month of 2026
Completed trip revenue YTD
$5.61M
216 stays completed Jan–Jul
Revenue per completed trip
$25,971
vs $28,969 in 2025 · mix shift
Revenue per booking total
$26,217
$26,787 forward avg · $25,971 completed avg
Marketing performance highlights — July 2026
Google Ads ROAS
15.2x
$91,085 confirmed on $6,006 spend
Forward-booked pipeline
$2.49M
93 future stays · Aug–Dec check-ins
Google Ads clicks
2,545
114,584 impressions · 2.22% CTR
Inbound calls (CallRail)
34
flat vs July 2025 · +36% vs June
2026 accommodations revenue by check-in month
Completed (Jan–Jul)
Forward booked (Aug–Dec)
2026 bookings by source — Hostfully Deep Dash
Most identified revenue on record, more in the pipeline
$8.10M identified through Jul 31 is 85.3% of the $9.5M goal — level with 2025's record pace and +$419K ahead in absolute dollars ($7.68M), the most ever identified at this point in the year. With $2.49M forward-booked across 93 future stays, only $1.40M remains to clear the goal cleanly.
July led the year
$1.47M of July accommodations revenue is the strongest completed month of 2026 and +17.8% ahead of July 2025 — the biggest month of the year landing above last year, not merely matching it. Mix shift continues: revenue per completed trip ($25,971) sits below 2025 ($28,969) as more mid-tier and shoulder-season stays enter the funnel alongside the flagship estates.
The Story
2026 is pacing level with the strongest year on record and ahead of it in absolute dollars. Identified accommodations revenue climbed from 47.3% of the $9.5M goal in early February to 85.3% by July 31 — matching 2025's record pace and +$419K ahead of it in dollars ($8.10M vs $7.68M), the most ever identified at this point in the year. $1.40M remains to close against $2.49M already forward-booked. All figures are the Jul 31 cut of Cody's Accommodations Flash Report; the Deep Dash + Flash Report tab carries the full breakdown.
2026 cumulative identified revenue vs $9.5M goal (by check-in month)
2026 snapshots — year to date (Flash Report cut)
| Snapshot | Completed YTD | Forward booked | Identified total | Goal | % of goal | Progress |
|---|---|---|---|---|---|---|
| Feb 4, 2026 | $361,807 | $4,134,902 | $4,496,709 | $9,500,000 | 47.3% | |
| Feb 11, 2026 | $508,923 | $4,307,914 | $4,816,837 | $9,500,000 | 50.7% | |
| Mar 25, 2026 | $1,593,290 | $4,117,484 | $5,710,775 | $9,500,000 | 60.1% | |
| Apr 13, 2026 | $2,071,847 | $4,606,543 | $6,678,390 | $9,500,000 | 70.3% | |
| Jun 2, 2026 | $3,128,136 | $4,093,312 | $7,221,449 | $9,500,000 | 76.0% | |
| Jun 30, 2026 | $4,145,308 | $3,661,313 | $7,806,620 | $9,500,000 | 82.2% | |
| Jul 31, 2026 latest | $5,609,721 | $2,491,230 | $8,100,952 | $9,500,000 | 85.3% |
Year-over-year — identified YTD (Flash Report cut)
| Year | Identified YTD | Goal | % of goal | Trips | Rev / booking | Progress |
|---|---|---|---|---|---|---|
| 2019 | $6,210,982 | $8,000,000 | 77.6% | 334 | $18,596 | |
| 2023 | $7,261,524 | $9,500,000 | 76.4% | 271 | $26,795 | |
| 2024 | $7,253,062 | $10,000,000 | 72.5% | 294 | $24,670 | |
| 2025 | $7,681,395 | $9,000,000 | 85.3% | 278 | $27,631 | |
| 2026 current | $8,100,952 | $9,500,000 | 85.3% | 309 | $26,217 |
Reading this honestly
2026's identified revenue by Jul 31 is $8.10M — 85.3% of the $9.5M goal, level with 2025's record pace and +$419K ahead of 2025 ($7.68M) in absolute dollars, the most ever identified at this point. Trip count (309) is the highest at this point in any tracked year. Average revenue per booking ($26,217) sits below 2025 ($27,631) — mix shift toward more mid-tier and shoulder-season stays, not pricing weakness.
Most on record, more in the pipeline
$8.10M identified through Jul 31 is 85.3% of the $9.5M goal — level with 2025's record pace and +$419K ahead in absolute dollars ($7.68M). Only $1.40M still to close to hit the $9.5M goal — comfortably within reach given the $2.49M already forward-booked across 93 future stays.
How to read forward bookings
Forward bookings represent paid or confirmed upcoming stays. The gap between Identified ($8.10M) and Completed YTD ($5.61M) = $2.49M in confirmed future revenue. As trips complete through the year, Completed will rise toward Identified — and new bookings keep adding to both.
The Story
This tab mirrors the two Hostfully exports Pure Kauai has historically used — the Deep Dash Accommodations Revenue Report and the Flash Report (YTD) — both as of Jul 31, 2026. Treat this as the source of truth for revenue pacing until we ship the automated daily Hostfully pull. The tables below reproduce Cody's Flash Report and Deep Dash views exactly, as of Jul 31, 2026.
Flash Report — Accommodations Revenue YTD
Accommodations Revenue Flash Report (YTD)
Data as of 7/31/26 · Identified Calendar-Year Revenue + Goal Gap by year (2019, 2023, 2024, 2025, 2026)
Cody's July 31 sheet

| 2019 | 2023 | 2024 | 2025 | 2026 | |
|---|---|---|---|---|---|
| Completed trip revenue | $4,255,742 | $5,638,856 | $5,199,286 | $5,591,028 | $5,609,721 |
| Booked YTD for rest of year | $1,955,240 | $1,622,668 | $2,053,776 | $2,090,367 | $2,491,230 |
| Identified revenue | $6,210,982 | $7,261,524 | $7,253,062 | $7,681,395 | $8,100,952 |
| Full-year goal | $8,000,000 | $9,500,000 | $10,000,000 | $9,000,000 | $9,500,000 |
| Revenue gap | $1,789,018 | $2,238,476 | $2,746,938 | $1,318,605 | $1,399,048 |
| % of goal | 77.6% | 76.4% | 72.5% | 85.3% | 85.3% |
| Identified trips | 334 | 271 | 294 | 278 | 309 |
| Rev per booking total | $18,596 | $26,795 | $24,670 | $27,631 | $26,217 |
Deep Dash — Accommodations Revenue Report (full)
Deep Dash — full accommodations breakdown
YTD & Total revenue by month / quarter / half · Bookings by source · Bookings by date (year prior + year of)
Cody's July 31 sheet

| Check-in month | 2026 | 2025 | YoY |
|---|---|---|---|
| Jan | $309,807 | $396,977 | −22% |
| Feb | $388,913 | $397,776 | −2% |
| Mar | $1,119,490 | $1,199,746 | −7% |
| Apr | $450,523 | $830,609 | −46% |
| May | $785,703 | $356,398 | +121% |
| Jun | $1,082,261 | $1,158,824 | −6.6% |
| Jul | $1,473,025 | $1,250,699 | +17.8% |
| Aug (booked) | $546,111 | $738,237 | −26% |
| Sep (booked) | $115,026 | $177,150 | −35% |
| Oct (booked) | $75,864 | $213,525 | −64% |
| Nov (booked) | $735,864 | $590,470 | +25% |
| Dec (booked) | $1,018,365 | $1,718,146 | −41% |
| Total identified | $8,100,952 | $9,028,556 |
Months Jan–Jul are completed check-ins; Aug–Dec are forward-booked. 2026 booking value by source: Hostfully $6.77M (~87%) · Vrbo $598K · Airbnb $287K · HVMB $73K · Whimstay $10K · TravelStaytion $4K.
Why this view exists
Cody's two PDFs are how Pure Kauai has been seeing pacing for years. Mirroring them in the report keeps continuity with the format the leadership team is used to, while we build the automated daily Hostfully pull that will replace this with a live view.
Why we use this view across the report
Every revenue and pacing number elsewhere in this report (Overview, Revenue Pacing tab, one-pager) is sourced from this Flash Report cut — accommodations rent by check-in month against the calendar-year goal. This keeps the numbers consistent with what Cody and the Pure Kauai leadership team have used for years.
🔗
Open the full Organic dashboard
RightNow Communications hosts the live, interactive Organic + SEO dashboard for Pure Kauai. Click through for the full set of traffic, content, AI Visibility and geo views.
View on RightNow →
The Story
Organic Search is the largest single source of visitors in July and it came back strong: 6,278 sessions (51.4% of all traffic, +35% YoY) and $61,704 in attributed revenue (+$31,670 YoY). SEO pageviews rose +54% YoY as the island-guide content tracked again after the Framer migration — the top guide alone drew 1,853 views. Phone calls from Google Organic held at 11 (+22% YoY). AI Visibility holds at 26/100 (Low) — the AEO tracker refreshes on a lag, so the latest available reading (695 citations across 138 cited pages) is unchanged from last month.
Headline metrics for July 2026
Organic-attributed revenue
$61,704
+$31,670 YoY · 75.98 key events
Organic search sessions
6,278
+35.3% vs July 2025 · 51% of traffic
SEO pageviews
12,496
+54% vs July 2025
Time on site (organic)
1:14
Clarity-measured engagement
ROI comparison: Organic vs Paid Search
Organic Search
Revenue earned with zero media spend in July
$61,704
attributed revenue
| Ad spend | $0 |
| Sessions | 6,278 |
| Key events | 75.98 |
| Media ROAS | No media cost |
Google Ads (for comparison)
Same month, paid channel
$91,085
confirmed conv value
| Ad spend | $6,006 |
| Confirmed conversions | 1 |
| Cost per conversion | $6,006 |
| Media ROAS | 15.2x |
Combined channel story
Organic search generated $61,704 in attributed value in July on zero media spend, up +$31,670 YoY — and the confirmed Google Ads booking added $91,085 on $6,006 of spend. Organic is the most efficient per dollar and is again the larger, faster-growing channel after June's dip; the two grow together as content shipping accelerates and Smart Bidding gets cleaner signal.
AI Visibility — baseline for the AEO program
AI Visibility: 26/100 (Low) — holding (tracker lags a cycle)
AI Visibility holds at 26/100 — the AEO tracker refreshes on a lag and the latest available reading is unchanged from last month: 695 citations across 138 cited pages, 64 mentions. AI Mode is the strongest surface (24 mentions, 37.5% share), followed by AI Overview (17, 26.6%). Gemini (14) and ChatGPT (9) are the upside. 98.4% of mentions are US-based — international AEO is wide open. The July movement that matters is downstream: organic revenue nearly doubled and the island-guide content is fully tracking again, feeding these surfaces more pages to cite.
| AI Surface | Mentions | Share of mentions | Status (lagged) |
|---|---|---|---|
| Google AI Mode | 24 | 37.5% | held |
| Google AI Overview | 17 | 26.6% | held |
| Gemini | 14 | 21.9% | held |
| ChatGPT | 9 | 14.1% | held |
| Aggregate — 26 / 100 | 64 | 100% | latest available |
Top performing content for July 2026
The island-guide blog is fully tracking again after June's Framer-migration artifact — the top guide drew 1,853 views and the guide library is back to carrying real top-of-funnel volume alongside the property pages.
Top island-guide articles
| 01 | What is the best month to go to Kauai | 1,853 |
| 02 | Where to see turtles in Kauai | 591 |
| 03 | Things to do in Kauai when it rains | 415 |
| 04 | Where to surf in Kauai | 354 |
| 05 | The best beaches in Kauai for swimming | 289 |
| 06 | What to do in Princeville | 184 |
Pageviews in July
Top property pages
| 01 | Anini Bikini | 876 |
| 02 | Ikena Lani | 754 |
| 03 | Secret Cove | 688 |
| 04 | Hale 'Ae Kai | 504 |
| 05 | Anini Vista Drive Estate | 496 |
| 06 | Hanalei Plantation Villa | 472 |
Pageviews in July
The Story
July logged 34 inbound calls, up from June's 25 (+36%) and level with July 2025 — the volume dip flagged last month has recovered. That answers June's open question in favour of a shoulder-season lull rather than a broken forwarding chain. Direct led with 12 calls and Google Organic held strong at 11 (+22% YoY) — island-guide content converting straight to phone bookings. Every call reached the reservations team cleanly.
Headline call metrics — July 2026
Total inbound calls
34
flat vs July 2025 · +36% vs June
Unique callers
29
1.2 avg calls per caller
Calls from Google Organic
11
+22% vs July 2025 · 32% of all calls
Calls vs prev period
+36%
25 in June → 34 in Jul
Call attribution by source
| Source | Calls | YoY change | Read |
|---|---|---|---|
| Direct | 12 | +33% | Returning guests + people who already know the brand |
| Google Organic | 11 | +22% | SEO doing work — island-guide content converting straight to calls |
| www.purekauai.com | 3 | +200% | Direct visits to the site that then called |
| Newsletter | 3 | +100% | Email list starting to drive inbound calls |
| Yahoo Organic | 2 | +100% | Secondary search engine |
| Google Ads | 1 | −90% | Paid clicks to a phone call |
| Pinterest Organic | 1 | +100% | Tail social / search source |
| Bing Organic | 1 | +100% | Tail search source |
Top tracking numbers
| Tracking number | Calls | Unique callers | Avg duration | YoY |
|---|---|---|---|---|
| Website pool — 808-582-8904 | 17 | 14 | 0:52 | +143% |
| Website pool — 808-755-1514 | 4 | 4 | 2:58 | −33% |
| Newsletter — 808-427-2403 | 3 | 3 | 1:06 | +100% |
| Website pool — 808-378-7783 | 3 | 3 | 3:53 | +50% |
| Website pool — 808-470-5220 | 2 | 2 | 1:19 | +100% |
| Website pool — 808-736-3371 | 2 | 2 | 4:55 | −50% |
Volume recovered, organic still strong
34 calls in July is +36% over June and level with July 2025 — the dip flagged last month has closed. Direct led with 12 and Google Organic held at 11 (+22% YoY), the island-guide content still turning searches into phone bookings. The 808-582-8904 website pool carried the bulk (17 calls) and every call reached the reservations team cleanly.
What the recovery tells us
June's low count now reads as a shoulder-season lull rather than a broken forwarding chain — the answer to last month's open question. Newsletter also showed up as a fresh source (3 calls on a dedicated tracking number), a sign the email list is starting to drive inbound calls. Worth keeping the newsletter number tagged so that channel stays measurable.
The Story
Brand carried the month. The Brand campaign returned $91,085 in confirmed conversion value on just $205 of spend — the account's single tracked conversion, one high-value flagship booking, at a 90.8% impression share and 53% CTR. Account-wide July ROAS landed at 15.2x ($91,085 on $6,006), up from June's 7.4x on the strength of that one booking. Confirmed-conversion volume stays thin: the Geo, California and Secret Beach campaigns spent $5,801 between them with zero tracked conversions this month.
Headline metrics — July 2026
ROAS
15.2x
$91,085 conv value / $6,006 spend
Spend
$6,006
vs $6,915 in June (−13%)
Clicks
2,545
114,584 impressions · 2.22% CTR
Avg CPC
$2.36
Confirmed conversions: 1 · CPA $6,006
Campaigns with spend in July
| Campaign | Channel | Spend | Clicks | Conv | Conv $ | ROAS | Verdict |
|---|---|---|---|---|---|---|---|
| Brand | Search | $205 | 324 | 1.0 | $91,085 | 443x | scale |
| Pure Kauai Main (Geo) | Search | $2,377 | 1,013 | 0 | $0 | — | watch |
| Pure Kauai California | Search | $1,783 | 423 | 0 | $0 | — | audit |
| PMax — California Target | PMax | $1,064 | 695 | 0 | $0 | — | audit |
| Secret Beach | Search | $577 | 90 | 0 | $0 | — | watch |
Brand is the efficiency king
Brand spent just $205 and returned $91,085 in confirmed conversion value — one high-value flagship booking, the account's only tracked conversion this month, at a 90.8% impression share and 53% CTR. Geo drew 1,013 clicks at a 9.7% CTR but carried no confirmed booking tag in July. Keep funding Brand and Geo; they are doing the measurable work.
California is still bleeding
Pure Kauai California ($1,783), PMax California Target ($1,064) and Secret Beach ($577) — combined $3,424 — produced zero confirmed conversions in July, the same pattern as prior months at 57% of total spend with no tracked return. PMax California's 0.71% CTR is the weakest signal in the account. Two angles: clicks landing but not converting, or conversions completing later via Direct/Organic. The GA4 + BookingBridge cross-check is the next step before reallocating.
Conversion actions firing in July
| Action | Category | Events | Conv $ |
|---|---|---|---|
| Purchase (BookingBridge) | Purchase | 1.00 | $91,085 |
| GA4 purchase (web) | Purchase | 18.00 | $580,562 |
| Form Capture | Default | 93.00 | — |
| Add to Cart | Add to cart | 186.00 | — |
| Phone call (GA4 event) | Phone call lead | 34.00 | — |
Conversion volume is thin — protect the signal
July logged just 1 confirmed conversion account-wide, on Brand, because Google Ads counts only confirmed BookingBridge purchases. One booking worth $91,085 lifts the headline ROAS, but the thin signal makes the zero-conversion campaigns hard to read — Geo drew 1,013 clicks with no confirmed booking tag, and those clicks may convert later via Direct/Organic and go un-credited. The GA4 + BookingBridge cross-check now in progress will settle it. Until then, hold California to a test budget and keep funding Brand and Geo.
Spend vs confirmed conversion value by campaign — July 2026
The Story
July saw 12,212 sessions and 24,173 pageviews — up +3% versus June, still below July 2025 (−38% / −41%) but the YoY gap is narrowing as organic recovers. The bigger story is revenue: GA4 attributed $580,562, up +100% from June and +5% YoY — the first positive year-over-year revenue month of the tracking rebuild. Behavior held up too: add-to-cart 186 (+56% YoY), form submits 93 (+31% YoY). The $580,562 sits against Hostfully's $1.47M of July check-ins — the gap is offline / agent-assisted booking activity, the signature of a relationship-driven luxury rental.
Headline web metrics — July 2026
Sessions
12,212
+3% vs June · −38% YoY
Pageviews
24,173
+3% vs June · −41% YoY
New users
8,582
−4% vs June · −42% YoY
GA4-attributed revenue
$580,562
+5% YoY · 18 purchases tracked
Traffic by channel
| Channel | Sessions | Share | YoY vs 2025 |
|---|---|---|---|
| Organic Search | 6,278 | 51.4% | +35.27% |
| Direct | 3,974 | 32.5% | −6.63% |
| Paid Search | 784 | 6.4% | −45.67% |
| Referral | 739 | 6.1% | +78.93% |
| Unassigned | 132 | 1.1% | +26.92% |
| Organic Social | 101 | 0.8% | −55.70% |
| AI Assistant | 67 | 0.5% | +100% |
| Cross-network | 60 | 0.5% | −96.68% |
Key events fired in July (GA4)
Add to cart
186
+56.30% YoY
Form submits
93
+30.99% YoY
Phone calls (GA4 event)
34
+9.68% YoY
Revenue attribution by channel (GA4)
| Channel | Revenue | YoY change | Key events |
|---|---|---|---|
| Direct | $249,887 | +$169,287 | 140.00 |
| Unassigned | $205,125 | +$109,975 | 51.11 |
| Organic Search | $61,704 | +$31,670 | 75.98 |
| Referral | $46,833 | +$46,832 | 49.85 |
| Paid Search | $17,013 | −$68,102 | 14.23 |
| Total (GA4 attributed) | $580,562 | +5% YoY | 331.17 |
Why GA4 revenue ($581K) and Hostfully revenue ($1.47M) disagree
GA4 attributes $581K of revenue to web sessions in July. Hostfully shows $1.47M of accommodations revenue for July check-ins. The gap is the offline / agent-assisted side of the business — guests who find Pure Kauai digitally, then call or email a reservation agent and complete the booking outside the website's tracked funnel. This is the signature of a relationship-driven luxury rental brand. Direct ($250K) and "Unassigned" ($205K) are the largest GA4 buckets precisely because the booking lifecycle frequently leaves the website mid-funnel.
Where the visitors came from in July
| Top US states | Sessions |
|---|---|
| California | 3,276 |
| Hawaii | 1,560 |
| Washington | 542 |
| Texas | 508 |
| Oregon | 423 |
| New York | 386 |
| Colorado | 338 |
| Arizona | 273 |
| Top countries | Sessions |
|---|---|
| United States | 10,991 |
| Singapore | 381 |
| Canada | 160 |
| India | 159 |
| United Kingdom | 77 |
| China | 56 |
| France | 49 |
| Germany | 48 |
Revenue turned positive year-over-year
GA4-attributed revenue hit $580,562 in July — up +100% from June and +5% YoY, the first positive year-over-year revenue month of the tracking rebuild. Add-to-cart (186, +56% YoY) and form submits (93, +31% YoY) both climbed. The site keeps doing more booking work per visitor — the entire point of the tracking rebuild and the AEO foundation.
The traffic gap is closing as organic recovers
Sessions are still −38% versus July 2025, but the gap narrowed from June's −46% as organic came back: organic search sessions rose +35% YoY and SEO pageviews +54% YoY. June's island-guide tracking artifact resolved — the top guide alone drew 1,853 views and the Framer-migrated URLs are firing GA4 again. The remaining YoY gap is worth a Search Console drilldown on general "Kauai" queries, but the trend has turned.
The Story
Social had a breakout July. Instagram views jumped +557% to 64,501, led by a single reel ("Top 6 Kauai Beaches") that pulled 41K views on its own. Facebook grew +274% to 9,392 views on the same creative, and YouTube added 5,995 views (+75%), 90.7 watch hours (+100%) and 34 subscribers (+183%). Each channel is broken out below with its Meta Business Suite and YouTube Studio detail.
Channel comparison — July 2026
| Channel | Views | Reach / Viewers | Interactions | vs prior month |
|---|---|---|---|---|
| 64,501 | 27,700 | 5,800 | +557% | |
| 9,392 | 5,049 | 149 | +274% | |
| YouTube | 5,995 | 50,106 impr | +34 subs | +75% |
InstagramJul 6 – Aug 2 · 64,501 views · 27.7K reached · 5.8K interactions
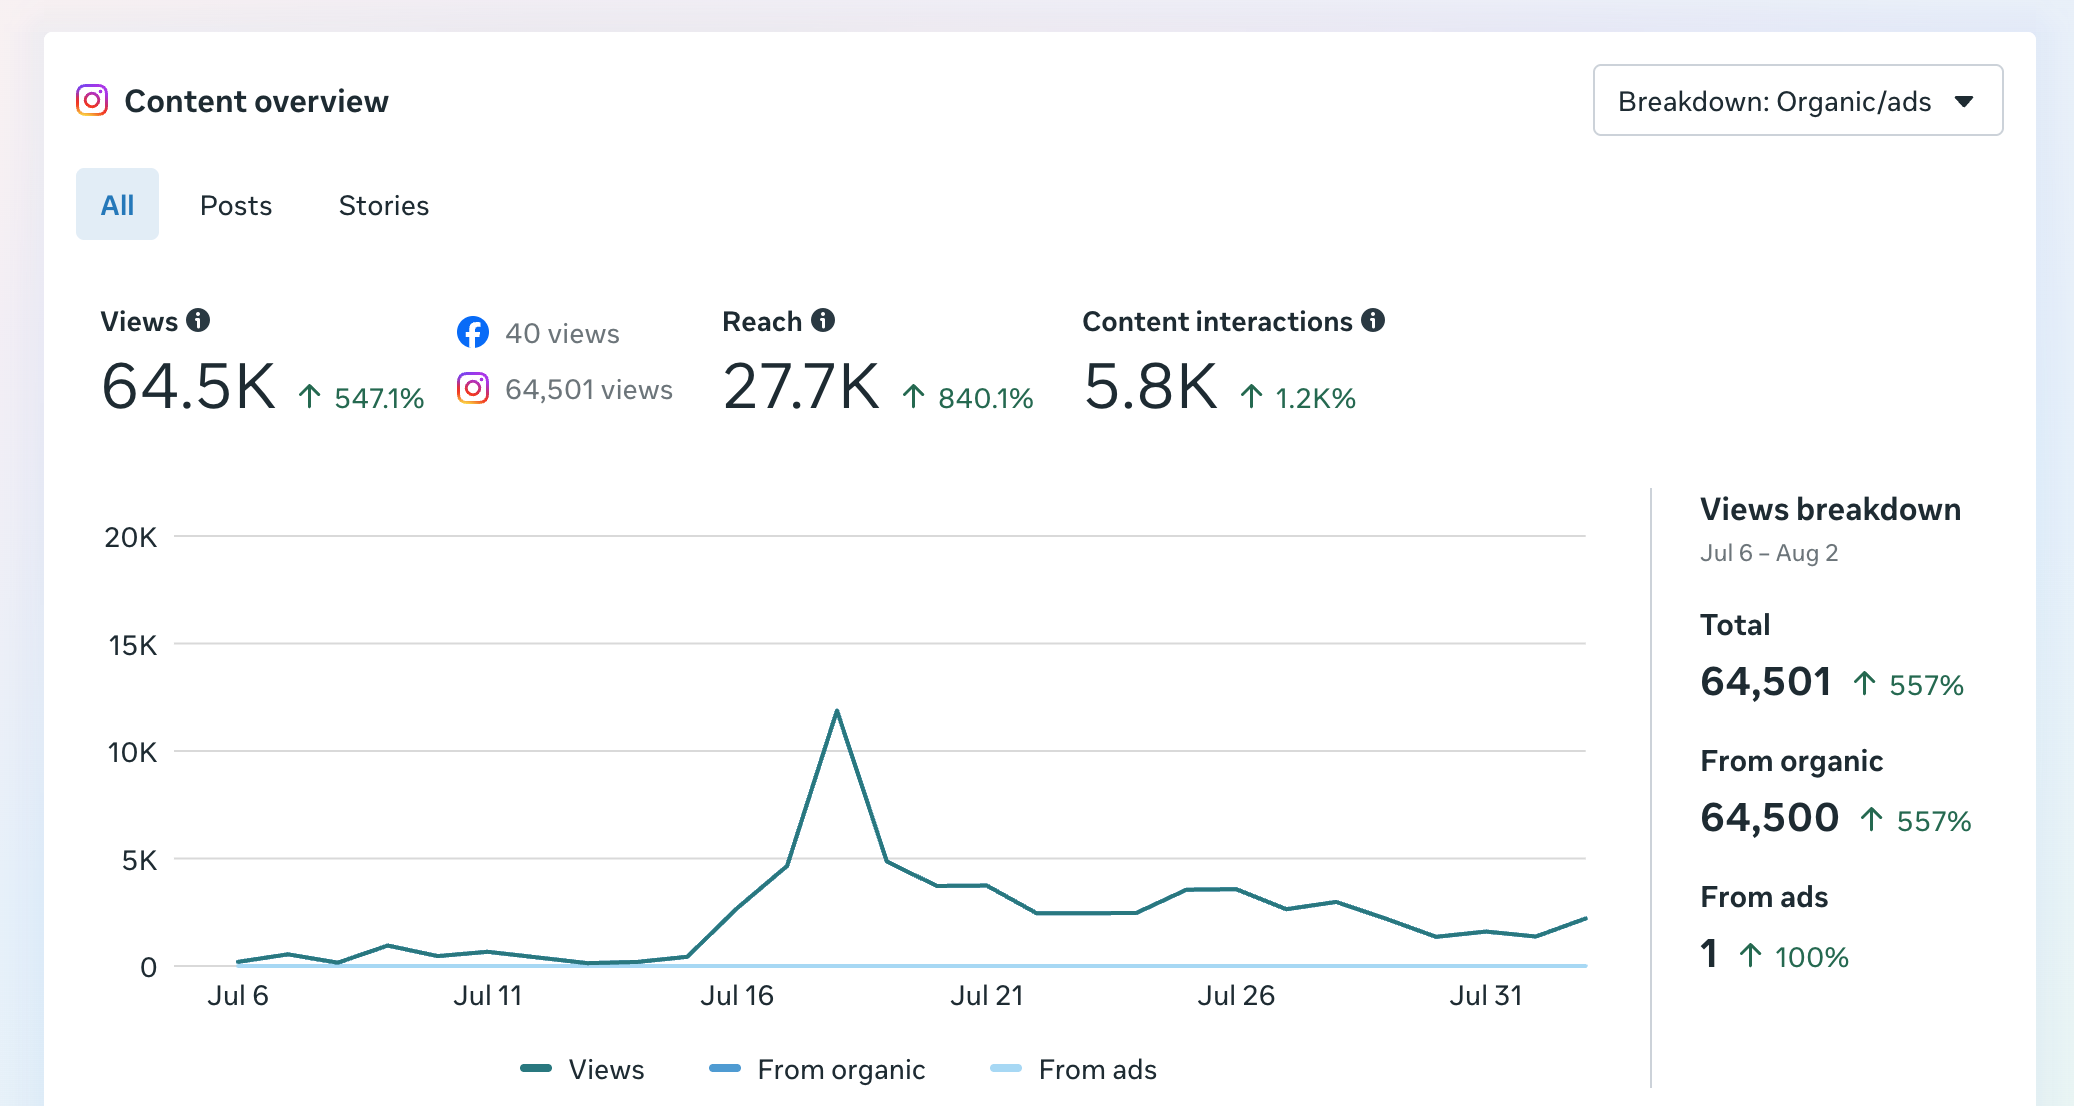
Instagram content overview (Meta Business Suite)
Top Instagram posts (by views)
| Post | Views | Likes | Shares |
|---|---|---|---|
| Top 6 Kauai Beaches (reel) | 41,000 | 901 | 1,000 |
| The reef keeps the water still (reel) | 5,500 | 141 | 24 |
| Twelve acres on Kauai's North Shore | 2,200 | 57 | 6 |
| Anini Vista Drive Estate | 1,700 | 40 | 8 |
| Me and you here? (no agenda) | 1,700 | 50 | 23 |
One reel carried the month
"Top 6 Kauai Beaches" pulled 41,000 views and roughly 1,000 shares on its own, about 64% of all Instagram views in July. It is a local-knowledge, save-and-share format rather than a property tour, which is exactly the top-of-funnel reach that seeds later bookings. Clear signal to make more in this style.
FacebookJul 1 – Jul 31 · 9,392 views · 5,049 viewers · 149 interactions
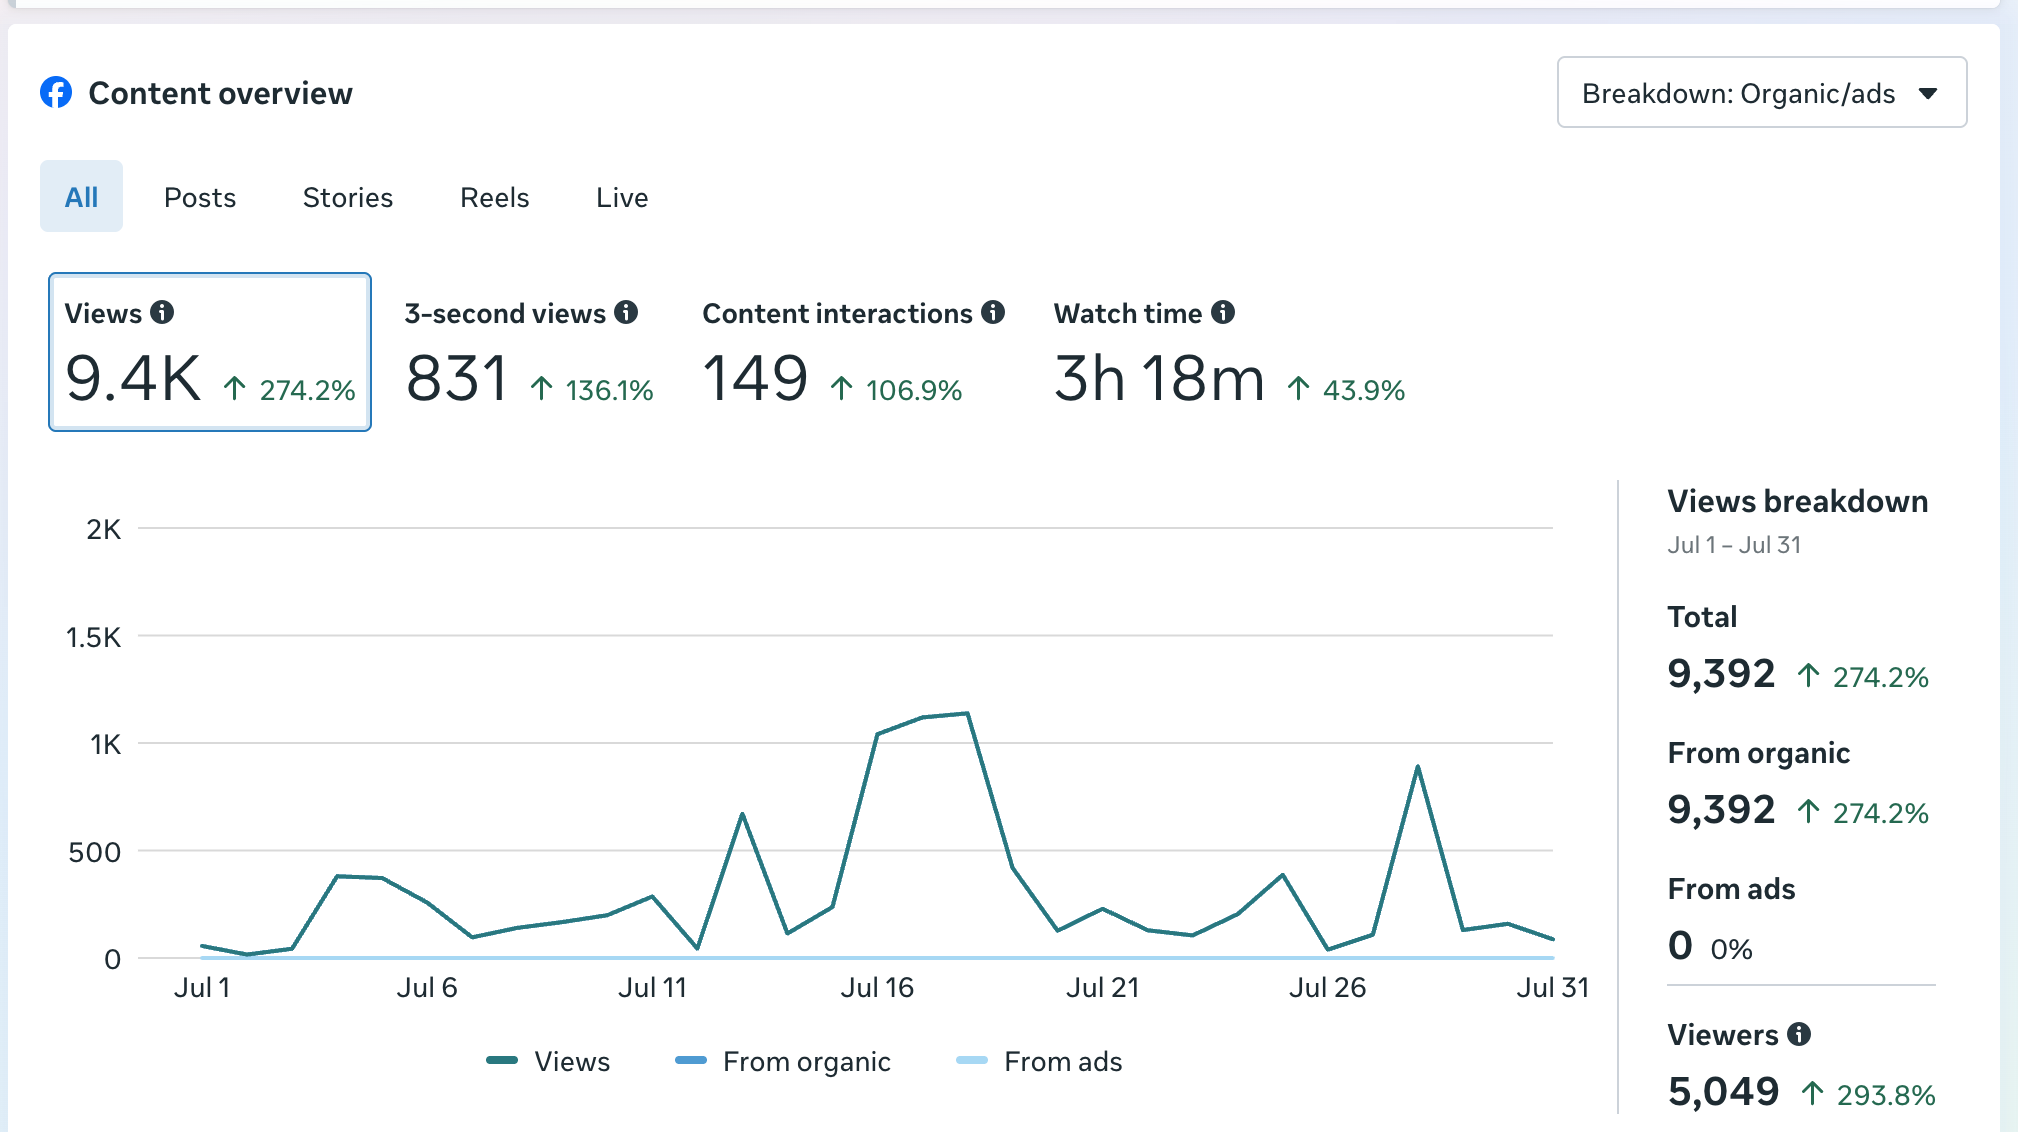
Facebook content overview (Meta Business Suite)
Facebook mirrors the creative for free reach
The same reels and estate content run on Facebook for incremental reach at no extra production cost: 9,392 views (+274%), 5,049 viewers (+294%), 149 interactions and 3h 18m of watch time in July, all organic. Smaller than Instagram, but a free second surface for every asset.
YouTubeJuly 2026 · YouTube Studio
Views
5,995
+75% vs prior month
Watch time
90.7 hrs
+100% vs prior month
Subscribers
+34
133 total · +183% vs prior month
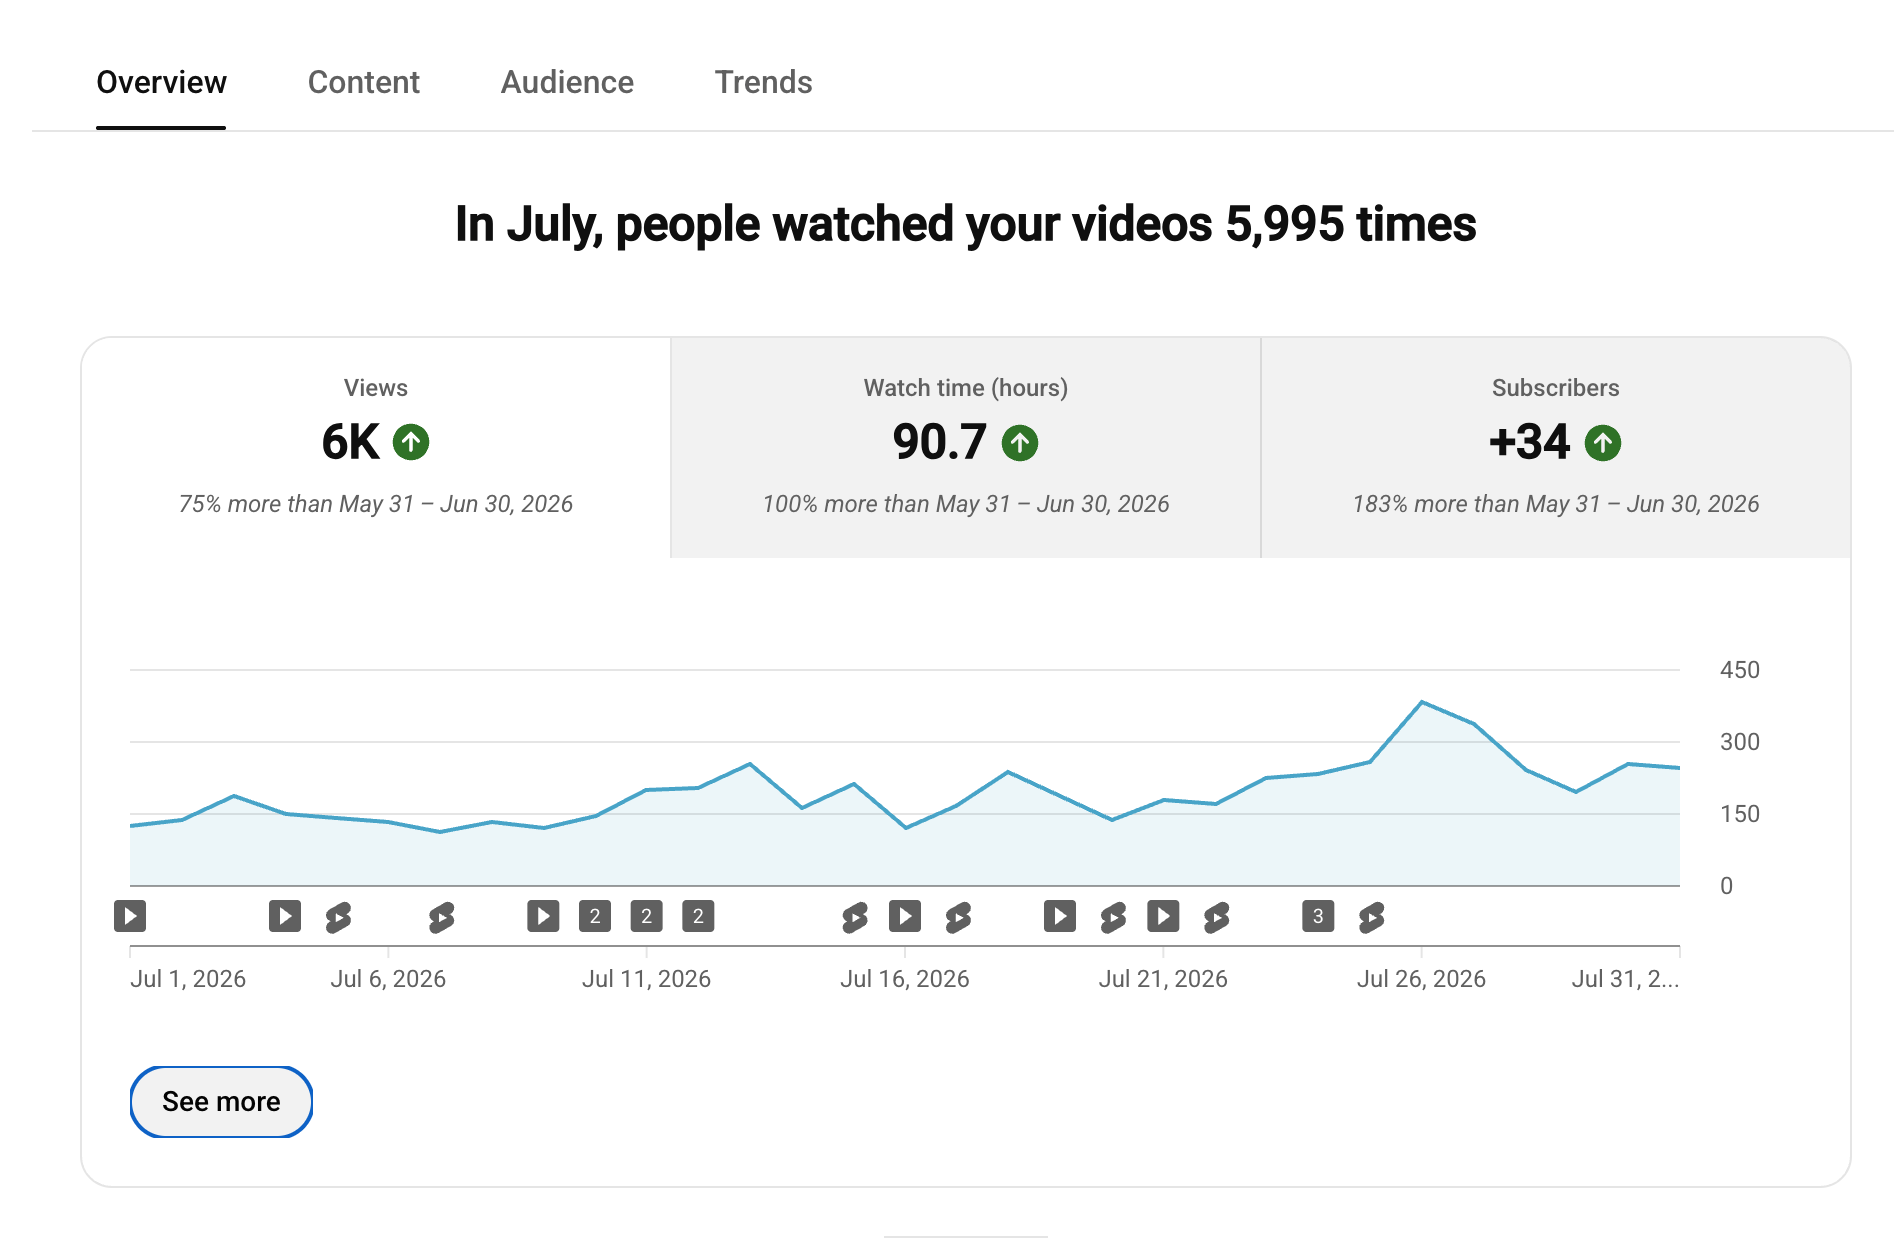
YouTube Studio overview
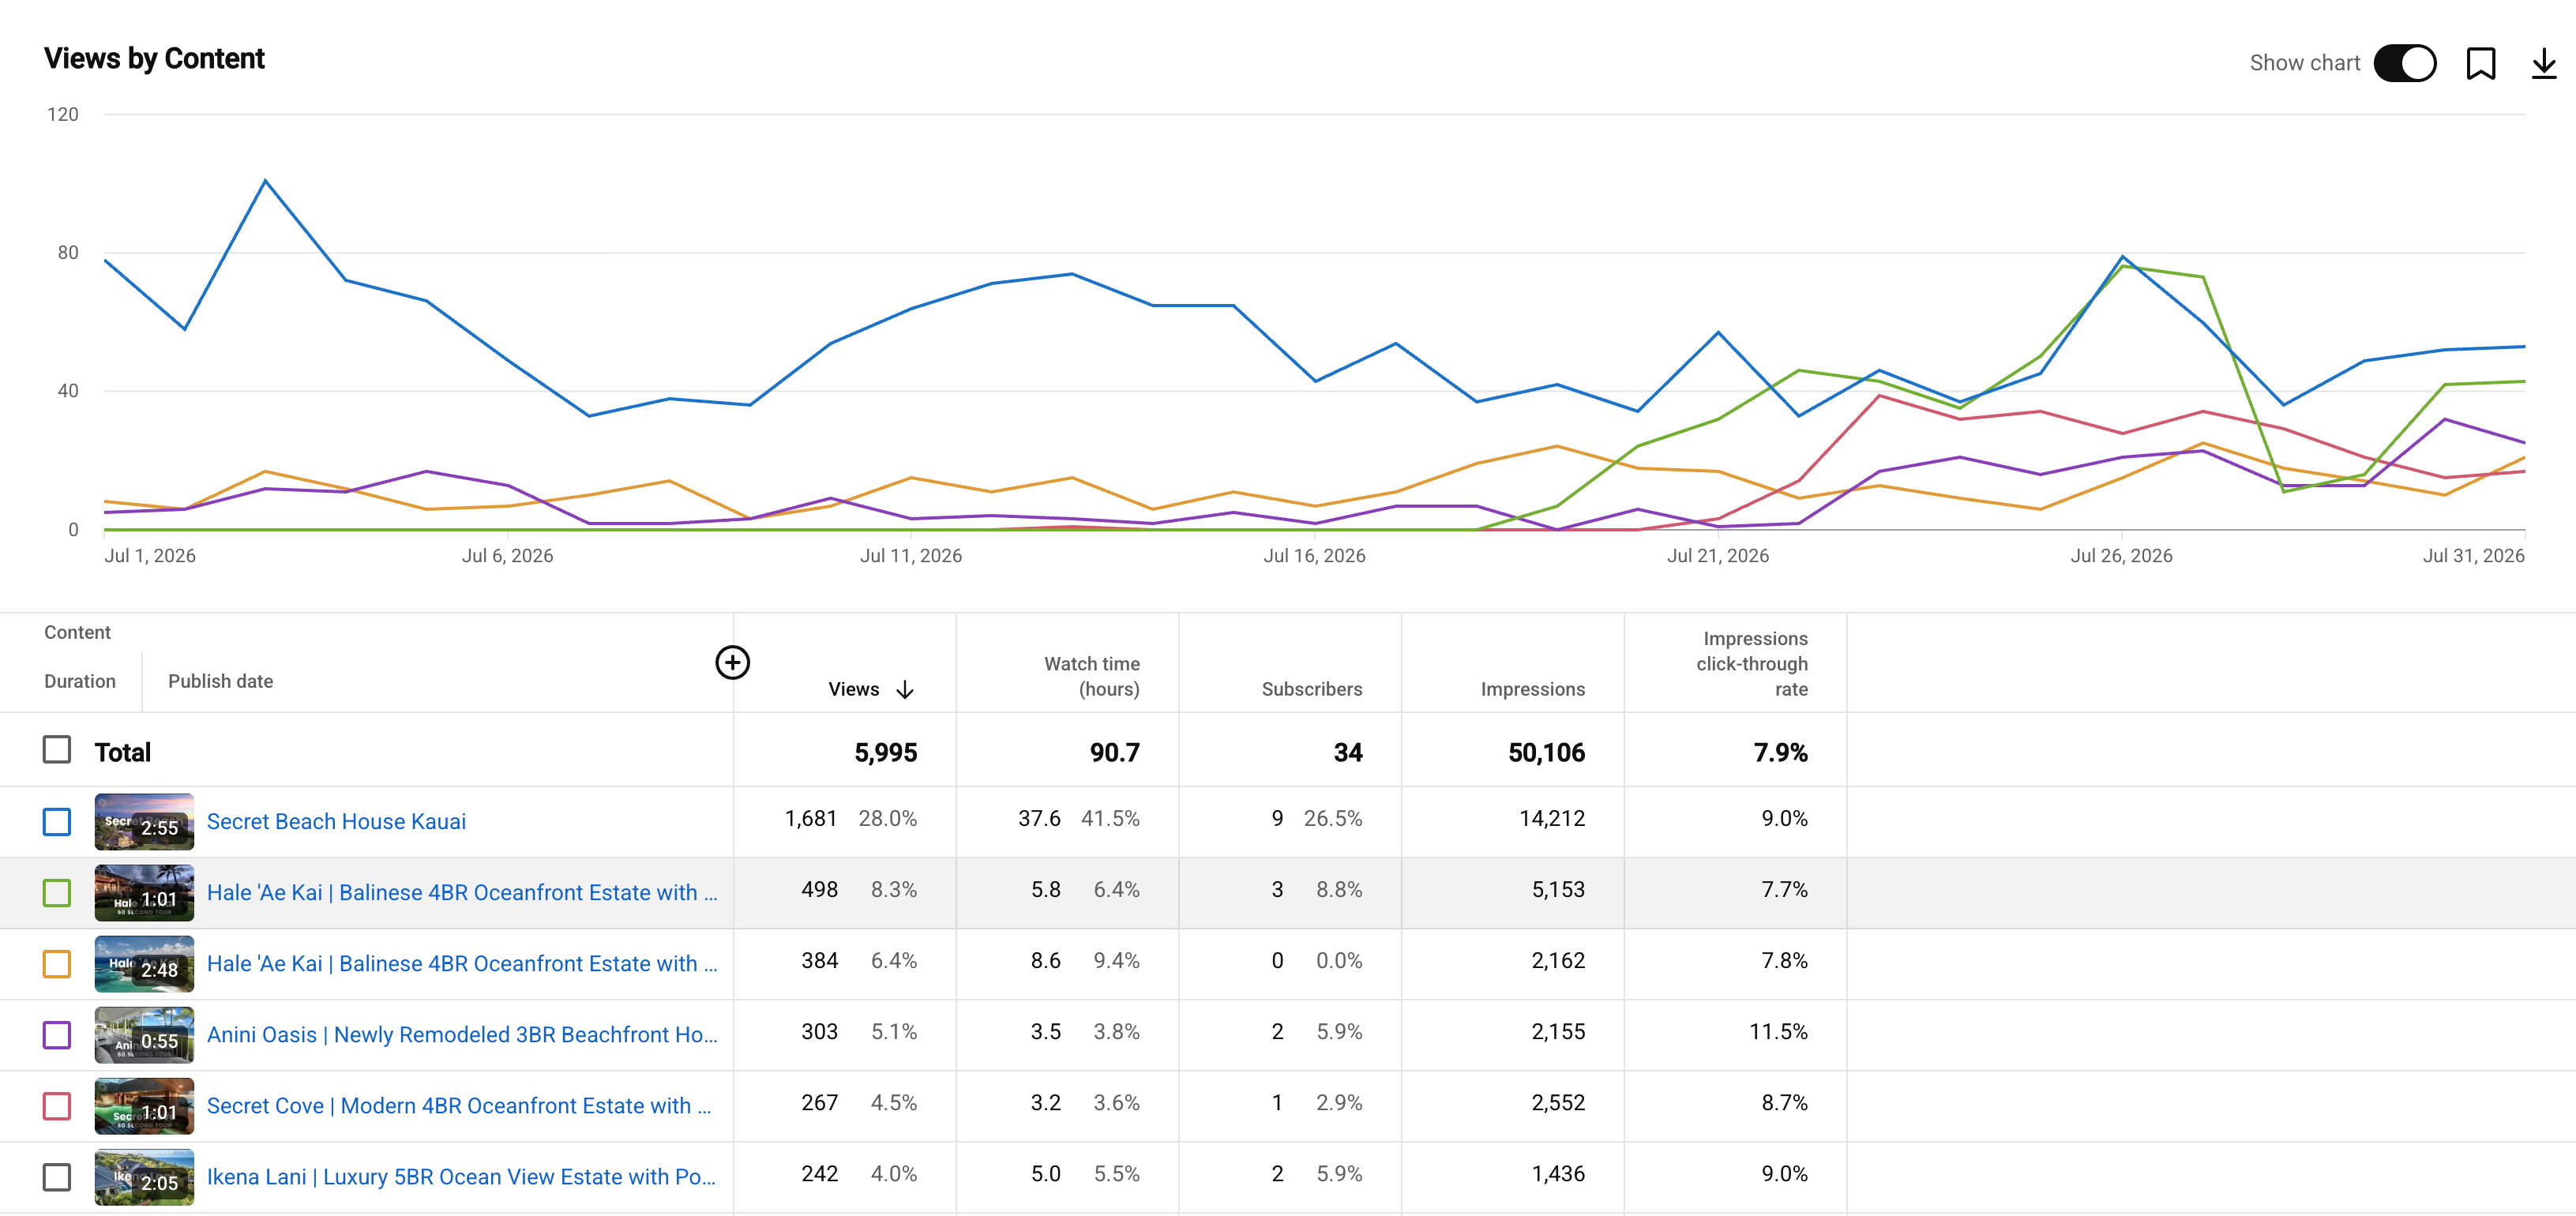
YouTube views by content (top videos)
Top YouTube videos (by views)
| Video | Views | Watch hrs | CTR |
|---|---|---|---|
| Secret Beach House Kauai | 1,681 | 37.6 | 9.0% |
| Hale 'Ae Kai — Balinese 4BR Oceanfront | 498 | 5.8 | 7.7% |
| Hale 'Ae Kai — Balinese 4BR (walkthrough) | 384 | 8.6 | 7.8% |
| Anini Oasis — Remodeled 3BR Beachfront | 303 | 3.5 | 11.5% |
| Secret Cove — Modern 4BR Oceanfront | 267 | 3.2 | 8.7% |
| Ikena Lani — Luxury 5BR Ocean View | 242 | 5.0 | 9.0% |
Secret Beach House still leads, and runs on ads
The top video, Secret Beach House Kauai (1,681 views, 28% of channel views), has paid promotion behind it, so its views are partly ad-boosted rather than purely organic. Worth keeping in mind when reading the +75% growth, though the rest of the property-tour library is all organic.
Property tours are the format that works
Every one of the top six videos is an estate tour, and the channel pulled 50,106 impressions at a 7.9% click-through rate in July. Anini Oasis posted the best CTR at 11.5%. Short, well-shot property walkthroughs are earning discovery on YouTube, a different audience than Instagram's reels.
Needs attention now
- California ad spend is still leaking. Pure Kauai California, PMax California Target and Secret Beach spent $3,424 (57% of July Google Ads spend) for zero confirmed conversions again. Run the California audit before next month's budget; PMax California's 0.71% CTR is the first thing to pull apart.
- Confirmed-conversion signal is thin. Just 1 tracked Google Ads conversion account-wide in July (a $91,085 Brand booking). The GA4 + BookingBridge cross-check is what settles whether Geo and California clicks convert later via Direct/Organic — the highest-leverage measurement task open.
Watch this month
- Add Contact / chat to the booking page. Clarity logged 5,393 sessions on property and booking pages in July with 3,755 dead clicks and 210 rage clicks; the founder counted four clicks to reach Contact Us from the booking flow. A one-click contact or chatbot on the booking page is the highest-leverage UX fix.
- Keep the newsletter tracking number tagged. A dedicated Newsletter line logged 3 calls in July — the email list is starting to drive inbound calls, worth keeping measurable as its own source.
- Watch that the organic recovery holds. Organic sessions (+35% YoY) and SEO pageviews (+54% YoY) both jumped after the Framer tracking fix; confirm the migrated island-guide URLs keep firing GA4 through August so the gain compounds.
Going well
- Most identified revenue on record — $8.10M identified, 85.3% of the $9.5M target, level with 2025's record pace and +$419K ahead in dollars.
- July was the biggest month of the year — $1.47M of accommodations revenue, +17.8% vs July 2025.
- Organic roared back — sessions +35% YoY, SEO pageviews +54% YoY, island-guide tracking restored, organic revenue $61,704 (+$31,670 YoY).
- Calls recovered to 34 (flat YoY, +36% MoM) and GA4 revenue nearly doubled to $580,562 (+5% YoY, first positive YoY month).
- Social had a breakout month — Instagram +557% to 64.5K views on a viral reel (41K), Facebook +274%, and YouTube +75% with +34 subscribers.